Figures & data
Figure 1. Acute cholecystectomy ratio and population density 2010–2019.
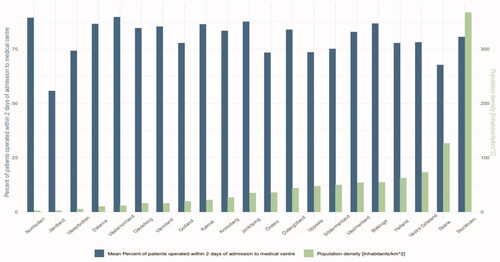
Table 1. Demographics of all the included patients with acute ongoing cholecystitis 2010–2019.
Table 2. The demographics of the included patients with ongoing cholecystitis divided regarding if they were operated in regions with or without TRC.
Figure 2. Acute cholecystitis – operated days on admission (%). Regions with or without tertiary referral centers (TRC).
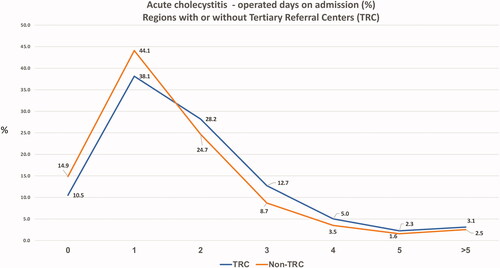
Figure 3. Performed acute cholecystectomies within two days on admission on patients with acute cholecystitis 2010–2019 in regions with or without TRC.
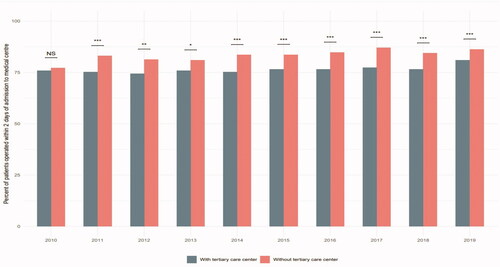
Table 3. Multivariable analysis of sex, age, ASA-class and regions with- or without tertiary care centers, and postoperative complications regarding the variable operated within two days.
Table 4. Acute cholecystitis – operated days on admission in the 21 administrative regions (%).
Table 5. Postoperative complications in regions with and without TRC during the studied time period.
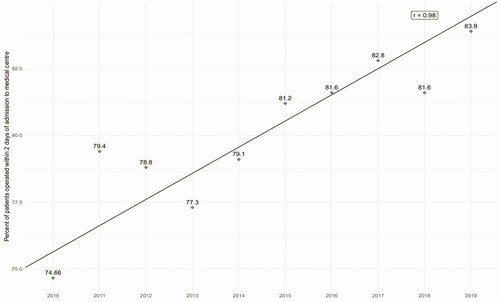
Figure 4. Mean of acute cholecystitis patients operated within two days in all Swedish regions combined 2010–2019.