Figures & data
Figure 1. Overview of the available registries and timeline for data availability.
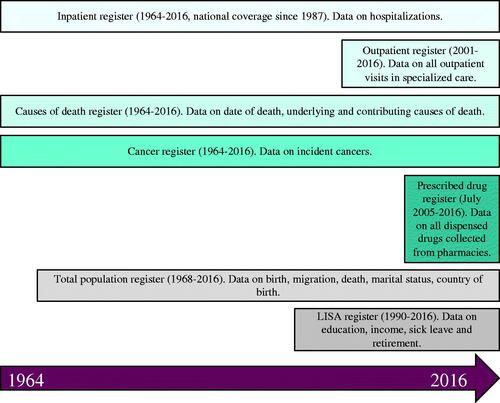
Table 1. ICD-codes used to define presence of liver disease and study baseline. Truncated codes contain data on all underlying codes. For instance, K70 also includes data on K703, etc.
Figure 2. Number of registrations in DELIVER for selected diagnoses, presented both as number of total diagnoses (light blue), and individual patients (dark blue). Note that there is likely to be overlap, i.e., some patients might have coding for both HCC and NAFLD.
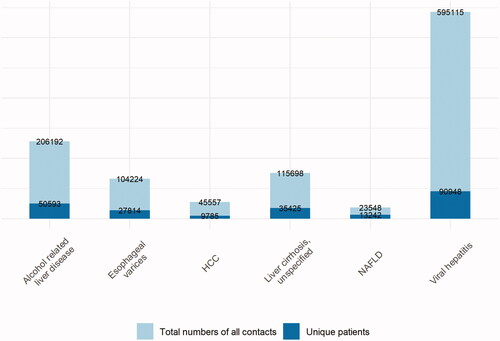
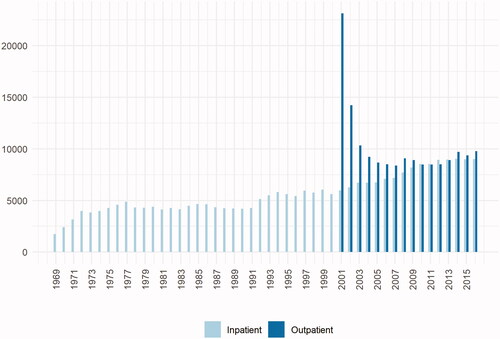
Figure 3. Number of unique patients with a first diagnosis of any liver disease in the inpatient and outpatient register, respectively. Note that a patient could be recorded in both registries. The high number of patients in the outpatient register in 2001 is due to lag since this was the initiation year of the outpatient register.