
Figures & data
Figure 1. Total incidence of HCC per 100,000 inhabitants in Region Stockholm 2003–2018. The dotted line represents linear trend.
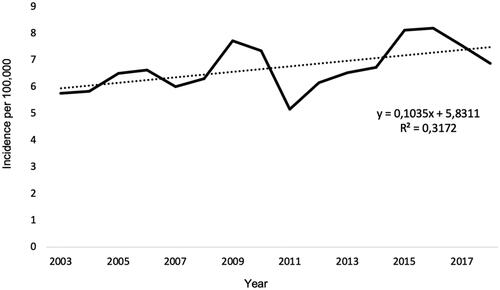
Figure 2. Age by 10-year age groups at HCC diagnosis in Region Stockholm 2003–2018.
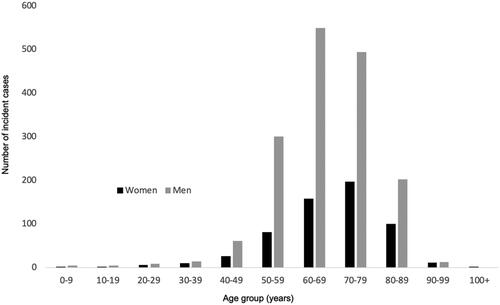
Table 1. Characteristics of the study population.
Table 2. Analysis of concordance between risk factors identified in the regional health care data register in Region Stockholm and in the clinical HCC register at Karolinska University Hospital 2014–2015.
Figure 3. Proportions of patients receiving different HCC treatments year 2010–2018.
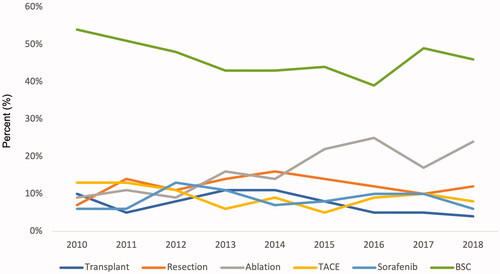
Figure 4. Overall survival probability after HCC diagnosis according to sex 2003–2018.
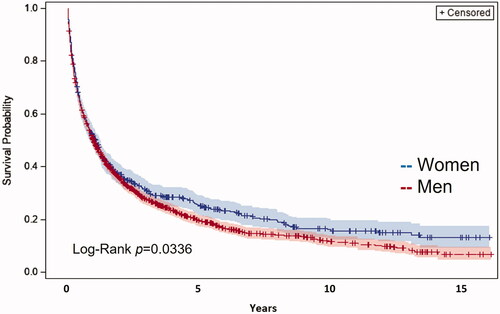
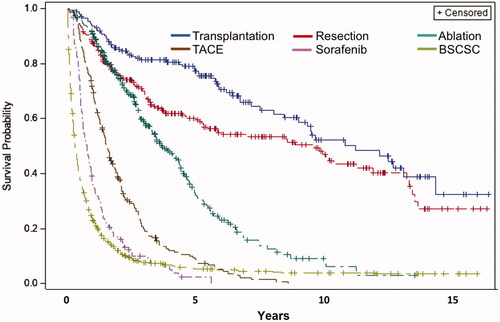
Figure 5. Overall survival according to mode of HCC treatment 2010–2018.
Supplemental Material
Download MS Word (1.4 MB)Data availability statement
The data that support the findings in this study are available from the corresponding author upon reasonable request.