
Figures & data
Figure 1. Case-control study groups formation after re-evaluation.
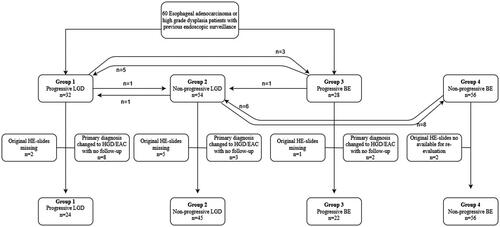
Figure 2. Demonstrating original HE microscopic slides in which primary diagnosis was changed from non-dysplastic metaplasia to low-grade dysplasia (a) after expert GI pathologist re-evaluation. (b) original LGD was downgraded to BE, (c) original LGD did not change and (d) original LGD diagnosis was upgraded to HGD. All images are taken with 20x magnification and 100 µm scalebar is found in image D.
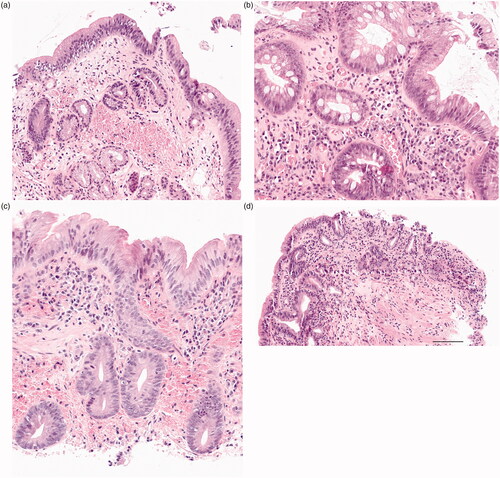
Table 1. Characteristics of patients grouped into different progression patterns according to re-assessed diagnoses.
Table 2. Comparison of original and expert GI pathologist diagnoses for each sample. Groups were stratified into progressors (progression to HGD or LGD) and non-progressors accordingly based on expert GI pathologist diagnoses.