
Figures & data
Table 1. Characteristics of the patients in the placebo and active treated groups.
Figure 1. Fecal microbiota transplantation (FMT) response rates in patients with severe and moderate irritable bowel syndrome (IBS) symptoms at 2 weeks, 1 month and 3 months after FMT in the placebo (A) and active treatment (B) groups. Changes in IBS symptom severity over time in the placebo (C, D) and active treatment group (E, F). ns, not significant; *adjusted p < .05; **adjusted p < .01.
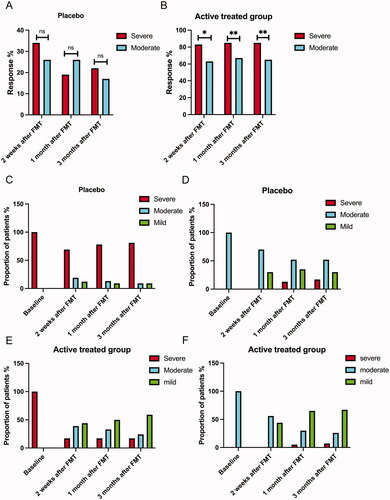
Figure 2. Total scores of IBS-SSS (A, B), of FAS (C, D), of IBS-QoL (E, F). at baseline and at 2 weeks, 1 month and 3 months after FMT. In (A) and (B), values above and below the red line indicate severe and moderate IBS symptoms, respectively. Values above and below the green line indicate moderate and mild IBS symptoms, respectively. ns, not significant; ***adjusted p < .001; ****adjusted p < .0001.
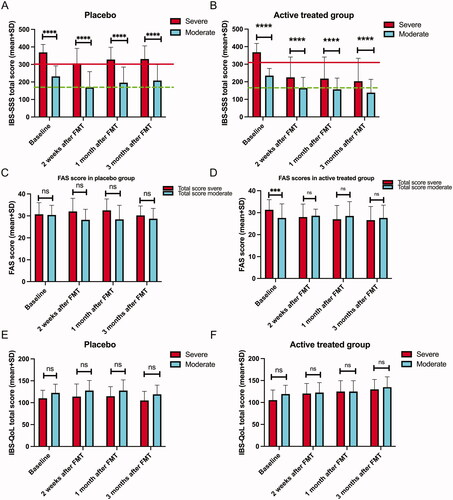
Table 2. IBS-SSS total scores and scores for the four items of the scale in patients with severe and moderate IBS symptoms in placebo and active-treated groups at different intervals following FMT.
Figure 3. The Dysbiosis index (DI) of patients with severe and moderate IBS symptoms at the baseline and 1 month after FMT in the placebo (A) and active treatment (B) groups.Comparison between DIs in patients with severe and moderate IBS symptoms at the baseline and 1 month after FMT in the placebo (C) and active treatment (D) groups. The bacteria whose fluorescence signals differed between patients with severe and moderate IBS symptoms belonging to the active treatment group at the baseline (E) and 1 month after FMT (F). ns, not significant; *adjusted p < .05; **adjusted p <.01; ****adjusted p < .0001.
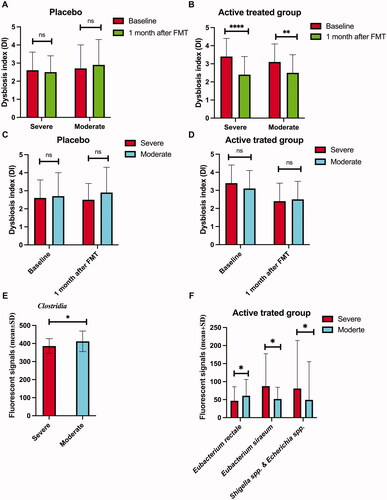
Table 3. FAS total scores and scores for physical fatigue and mental fatigue in patients with severe and moderate IBS symptoms in placebo and active-treated groups at baseline, 2 weeks, 1 month and 3 months after FMT.
Figure 4. Correlation between IBS-SSS total score, and Eubacterium rectale (A), Eubacterium siraeum (B) and Shigella spp. (C).
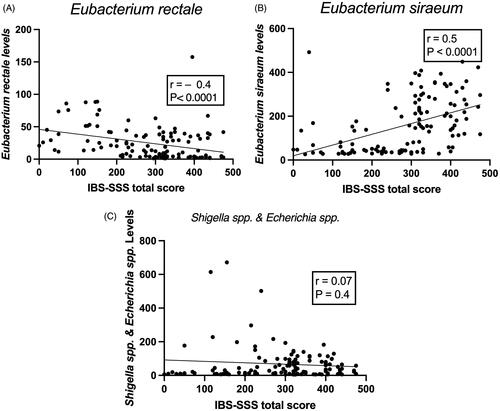
Table 4. IBS-QoL total scores and scores in the eight domains of the scale in placebo and active treated groups.
Table 5. The fluorescence signals of Eubacterium rectale, Eubacterium siraeum and Shigella spp. at baseline and 1 month after FMT in IBS patients with moderate IBS symptoms (Mo-IBS-S) and patients with severe IBS Symptoms (S-IBS-S).