1,223
Views
1
CrossRef citations to date
0
Altmetric
Original Articles

Validity of fatty liver disease indices in the presence of alcohol consumption

ORCID Icon, , , , , , , , , , & ORCID Icon show all
Pages 1349-1360 | Received 13 Apr 2022, Accepted 27 May 2022, Published online: 18 Jun 2022

Figures & data

Table 1. Characteristics of the study populations.

Figure 2. Boxplots of differences in index distribution between no FLD or FLD shown for different alcohol consumption groups; Finnish sample (A), German sample (B). Boxes represent the middle two quartiles, the horizontal line inside box represents median. Upper and lower quartiles are expressed as vertical lines within the range. Outliers are marked by dots. Alcohol consumption cut-offs (g/day) for males were <10, 10–30, 30–50, and >50. Corresponding cut-offs for females were <10, 10–20, 20–50, and >50.

Figure 2. Boxplots of differences in index distribution between no FLD or FLD shown for different alcohol consumption groups; Finnish sample (A), German sample (B). Boxes represent the middle two quartiles, the horizontal line inside box represents median. Upper and lower quartiles are expressed as vertical lines within the range. Outliers are marked by dots. Alcohol consumption cut-offs (g/day) for males were <10, 10–30, 30–50, and >50. Corresponding cut-offs for females were <10, 10–20, 20–50, and >50.

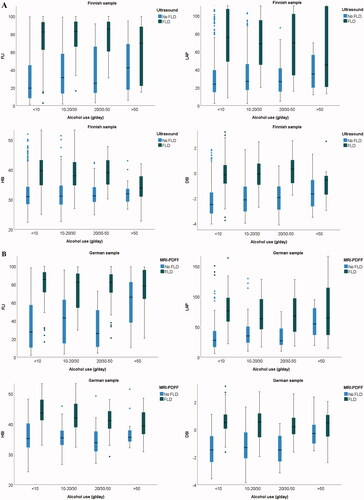
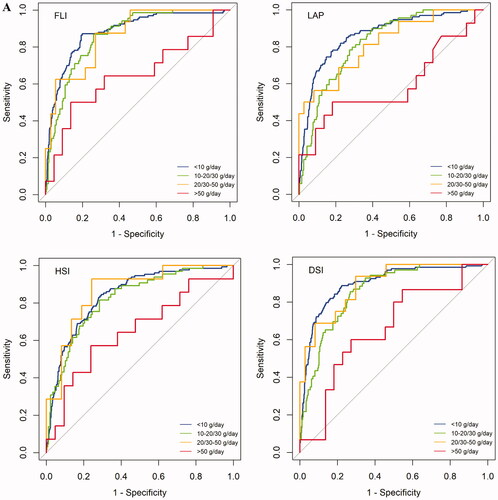
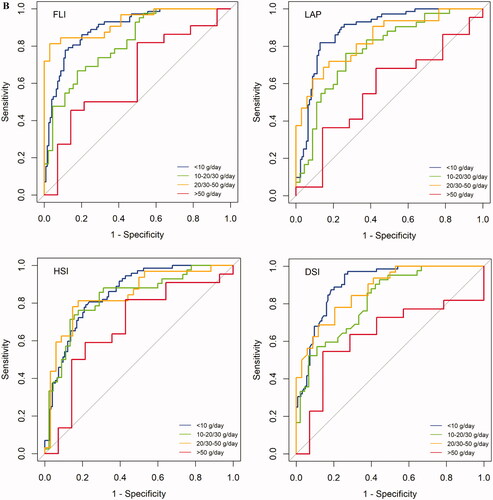
Table 2. AUROCs and 95% CIs for FLD indices to detect FLD according to alcohol consumption.

Table 3. Performance measures for FLD indices.

Supplemental material

Supplemental Material

Download MS Word (201.7 KB)