Figures & data
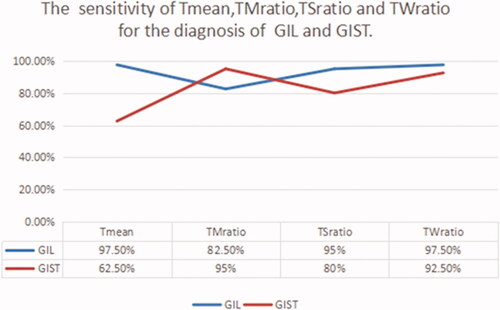
Figure 1. Flow diagram describing the selection of the study population.
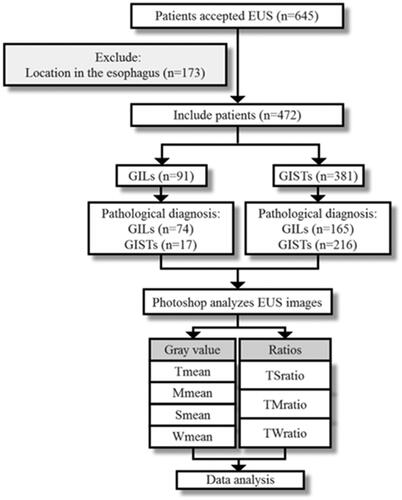
Figure 2. (A) EUS images of GIL, green arrow pointing to the tumor. (B) Selected region of interest labeled red bounding boxes after Photoshop processing. (C) The gray value of GIL. (D) EUS images of GIST, green arrow pointing to the tumor. (E) Selected region of interest labeled red bounding boxes after Photoshop processing. (F) The gray value of GIST.
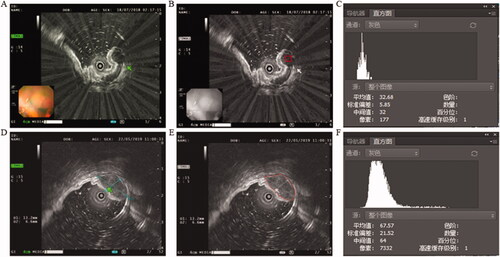
Table 1. Baseline characteristics of the patients with histologically confirmed GISTs or GILs.
Table 2. Detailed of gray value and the mean ratio values of GISTs and GILs by Photoshop.
Figure 3. The area under the ROC curve of GISTs and GILs. (A) Tmean and Tsd; (B) Mmean, Smean, and Wmean; (C) TMratio, TSratio, and TWratio.
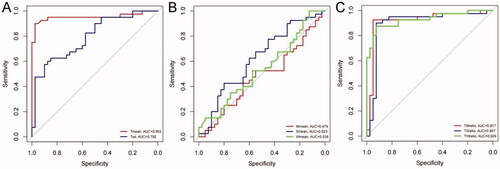
Table 3. Area under the curve, 95% CI, sensitivity, specificity, Youden Index and Cutoff point of datas for GISTs and GILs.
Figure 4. The sensitivity of Tmean, TMratio, TSratio, and TWratio for the diagnosis of GIL and GIST.