Figures & data
Table 1(a). Patient characteristics: biometrics, diagnoses and smoking before liver transplantation.
Figure 1. Flow chart. Legend: Flow chart of patient enrolment and classification by diagnosis. AC: alcohol-associated cirrhosis; HCV: hepatitis C induced liver cirrhosis; HCC: hepatocellular carcinoma. "Other" comprised all other liver diseases except AC, HCV and HCC.
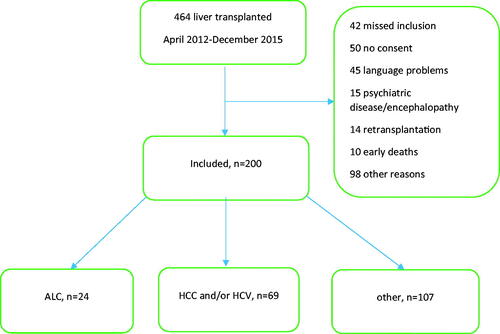
Table 1(b). Patient characteristics: socioeconomic, physical and psychiatric data before liver transplantation.
Table 1(c). Patient characteristics: drug and alcohol use before liver transplantation.
Table 2. Mortality, retransplantations and alcohol consumption the first two years after liver transplantation.
Table 3. The hazard ratio for overall mortality.
Table 4. The hazard ratio for graft loss.
Figure 2. (A) Overall survival is stratified by liver diagnoses. Legend: Overall survival stratified by liver diagnoses as a Kaplan-Meier plot during follow-up. Alcohol-associated cirrhosis, AC (orange), hepatocellular carcinoma, HCC, and/or hepatitis C, HCV (blue) and other diagnoses, Other (green). Log-rank test, p = 0.07. (b) Graft loss is stratified by liver diagnoses. Legend: Graft loss stratified by liver diagnoses as a Kaplan-Meier plot during follow-up. Alcohol-associated cirrhosis, AC (orange), hepatocellular carcinoma, HCC, and/or hepatitis C, HCV (blue) and other diagnoses, Other (green). Log-rank test p = 0.23.
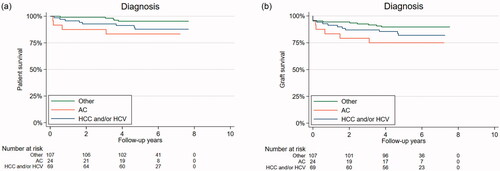
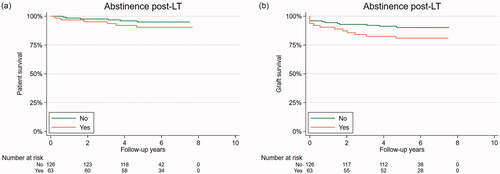
Figure 3. (a) Overall survival stratified by alcohol consumption or no alcohol consumption after liver transplantation. Legend: Overall survival stratified by alcohol consumption after liver transplantation as a Kaplan-Meier plot during follow-up. Abstinence post-LT = yes (orange), any alcohol consumption post-LT = no (green). Log-rank test, p = 0.11. (b) Graft loss is stratified by alcohol consumption or no alcohol consumption after liver transplantation. Legend: Graft loss stratified by alcohol consumption after liver transplantation as a Kaplan-Meier plot during follow-up. Abstinence post-LT = yes (orange), any alcohol consumption post-LT = no (green). Log-rank test, p = 0.07.