
Figures & data
Figure 1. Survival of pancreatic cancer in Sweden stratified by stage I to IV [Citation1].
![Figure 1. Survival of pancreatic cancer in Sweden stratified by stage I to IV [Citation1].](/cms/asset/bafc761c-a693-41f5-98c3-f530db2da77d/igas_a_2142481_f0001_c.jpg)
Table 1. Variables used in the cost estimation.
Table 2. Cost items included in diagnostics of false positive screening cases, number per patient and cost in SEK [Citation15,Citation31–33].
Figure 2. Positive and negative predictive values (PPV and NPV) for a blood test used to detect pancreatic cancer among different populations. The solid lines represent PPV (y-axis to the left) and the dotted lines represent NPV (y-axis to the right) when the test has a specificity of 0.80, 0.85, 0.90, 0.95 and 0.99.
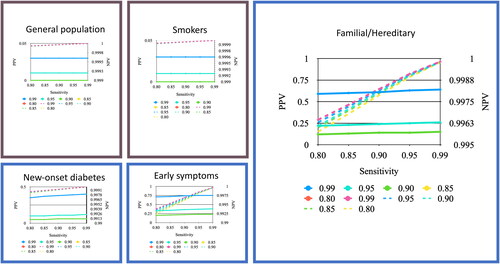
Figure 3. ICER of a blood test used to detect pancreatic cancer among different populations. The y-axis starts at EUR -50,000 as some ICERs were negative. The ICER for the general population and smokers continued over EUR 400,000 and are not visualized. Willingness to pay at EUR 100,000 is marked.
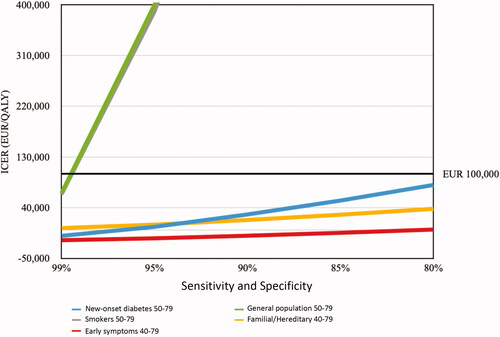
Table 3. Variables associated with the change in the specificity and sensitivity of the test.
Table 4. The pretest and posttest probability for a hypothetical test with sensitivity and specificity both set at 90% or 99%.
Table 5. Screening of new-onset diabetes patients between 50 and 79 years with a hypothetical test with sensitivity and specificity both at 80% or 99%.