
Figures & data
Figure 1. Flow chart of patients enrolled.
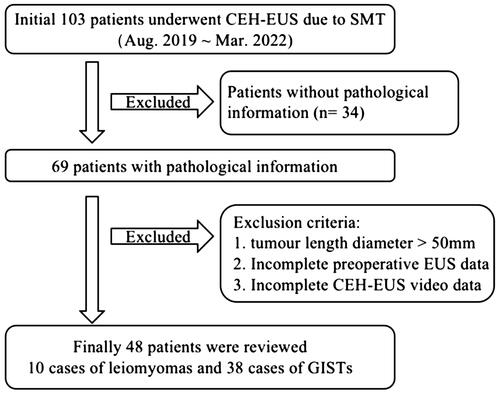
Table 1. Clinical characteristics between leiomyoma and GISTs.
Figure 2. Under CEH-EUS, the enhancement signal in the tumor was lower than that in the surrounding normal tissues and the enhancement of the tumor capsule was slightly weaker. Postoperative pathology was diagnosed as leiomyoma.
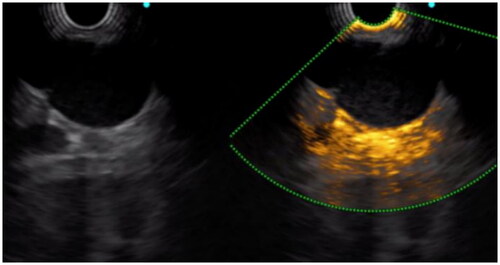
Figure 3. Under CEH-EUS, the enhancement signal in the tumor was stronger than that in the surrounding normal tissues and the enhancement of the tumor capsule was obviously enhanced. Postoperative pathology was diagnosed as GIST.
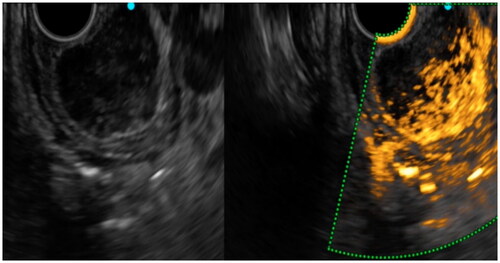
Table 2. Comparison of the diagnostic value of CEH-EUS and consistency tests.
Figure 4. Receiver-operating characteristic curve for the Signal appearance time (Area under the curve [AUC], 0.903).
![Figure 4. Receiver-operating characteristic curve for the Signal appearance time (Area under the curve [AUC], 0.903).](/cms/asset/dca62329-7e17-4da7-a0c0-e2a817d54018/igas_a_2144437_f0004_c.jpg)
Table 3. Arterial phase manifestations of GISTs at different risk levels.
Table 4. Characteristics of very low-low risk GISTs and intermediate-high risk GISTs.
Figure 5. We saw hyper-enhancement within the tumor, but the enhancement is very heterogeneous and non-enhancing spots were visible, which was pathologically confirmed as GIST with a high-risk classification.
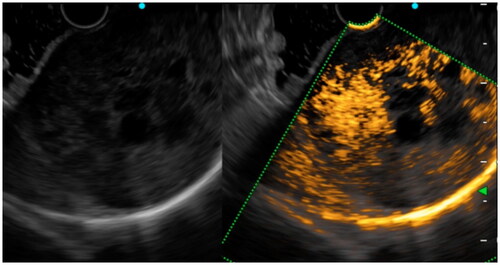
Figure 6. 10 s after contrast injection, we saw a continuous, irregular vessel of approximately 2 mm in diameter in the tumor, which was pathologically confirmed as GIST with an intermediate risk classification.
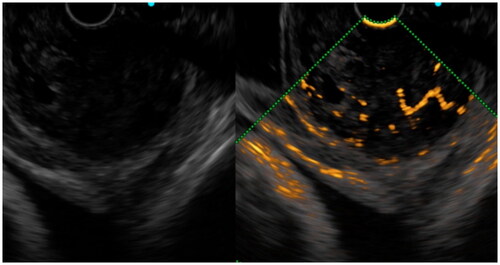
Table 5. Logistic regression model for independent predictors of GISTs.