
Figures & data
Figure 1. Screening flow chart of calculous cholecystitis patients.
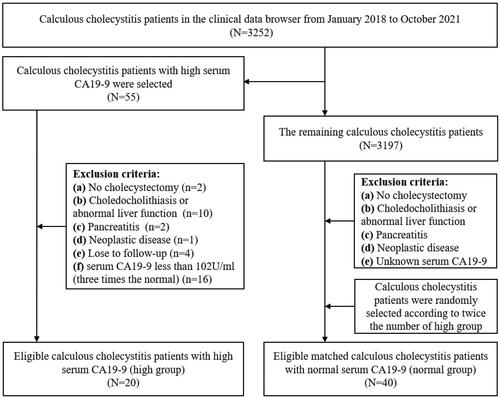
Figure 2. Morphology of gallbladder under MRI and HE staining. A ∼ B Cross-section view of gallbladder in high group and normal group under MRI. C ∼ D Gallbladder mucosa morphology of high group and normal group under HE staining (Scale bars = 50 μm). E Gallbladder wall thickness in the high group and normal group (Measured by Carestream on MRI). A and C, B and D are the same patients, respectively. P-value is determined by t-test. *** p < 0.001.
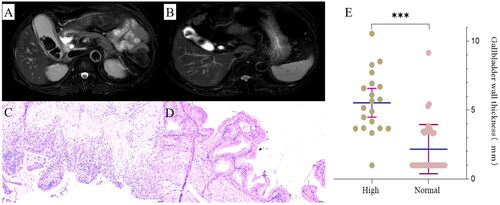
Table 1. Clinical characteristics of 60 patients in the high group and normal group.
Figure 3. The change of serum CA19-9 before and after CCY in the high group. (A) Pre-operative serum CA19-9 level in the high group and normal group. (B) Changes of serum CA19-9 before and after CCY in the high group (median follow-up time: 9 months). (C) Dynamic changes of serum CA19-9 in 4 patients within one month after CCY. Serum CA19-9 level of three patients with serum CA19-9 exceeding 1000 was marked as 1000 because laboratory only reported more than 1000 (upper limit of detection) instead of an accurate value. P-value is determined by t-test. *** p < 0.001.
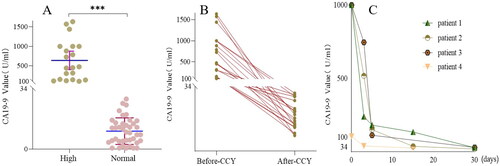
Figure 4. Expression of CA19-9 in different gallbladder regions in the high group. CA19-9 expression of mucosal epithelial cells, vascular endothelial cells, and intercellular substances or tumors in the negative control group(A ∼ C), normal group(D ∼ F), high group(G ∼ I), and positive control(J ∼ L). Scale bars = 50 μm.
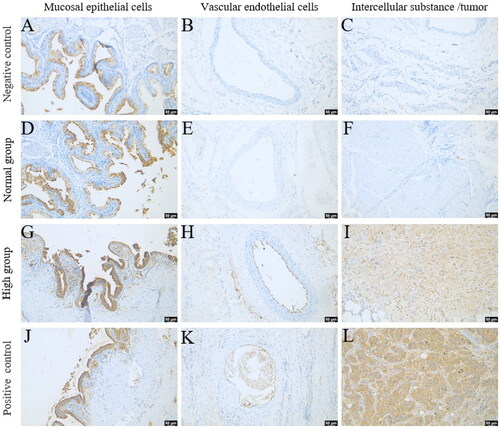
Table 2. Expression of CA19-9 in different gallbladder regions in all patients.