Figures & data
Figure 1. Shows the PRISMA flowchart of the study selection and inclusion process. *Consider, if feasible to do so, reporting the number of records identified from each database or register searched (rather than the total number across all databases/registers). **If automation tools were used, indicate how many records were excluded by a human and how many were excluded by automation tools.
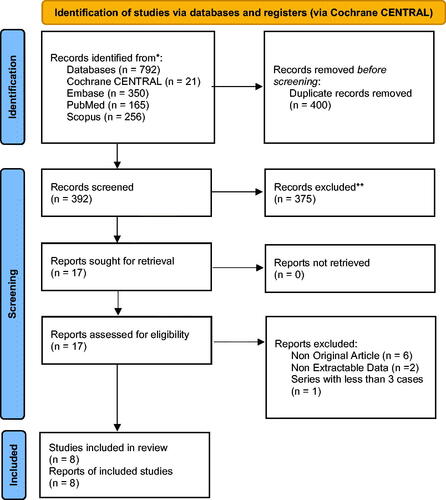
Table 1. Study & population characteristics.
Figure 2. Forest-plot summarizing the sensitivity of VCE (a) and conventional endoscopy (b). Estimates are weighted according to the inverse variance method. TP is short for true positives and FN is short for false negatives.
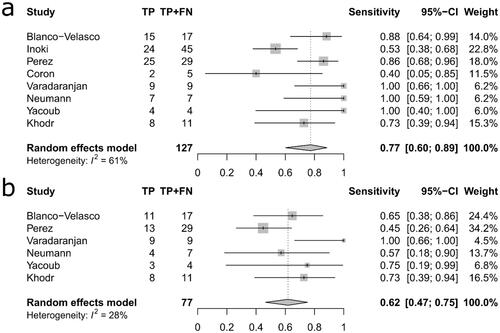
Figure 3. Forest-plot summarizing the specificity of VCE (a) and conventional endoscopy (b). Estimates are weighted according to the inverse variance method. TN is short for true negatives and FP is short for false positives.
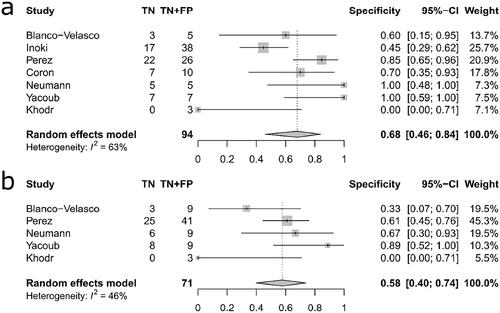
Table 2. Overview of study, population characteristics, and findings from VCE/conventional endoscopy/histopathology.
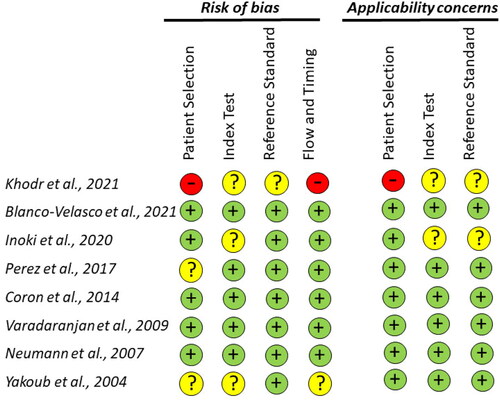
Figure 4. Quality assessment of diagnostic accuracy studies-2.