
Figures & data
Table 1. Conversion table for intervals of intravenous (IV) to subcutaneous (SC) administration.
Figure 1. CONSORT flow diagram of the patient cohort at the time of switch, at 6 weeks, 12 weeks and 26 weeks follow-up. VDZ: Vedolizumab; SC: subcutaneous; IV: intravenous.
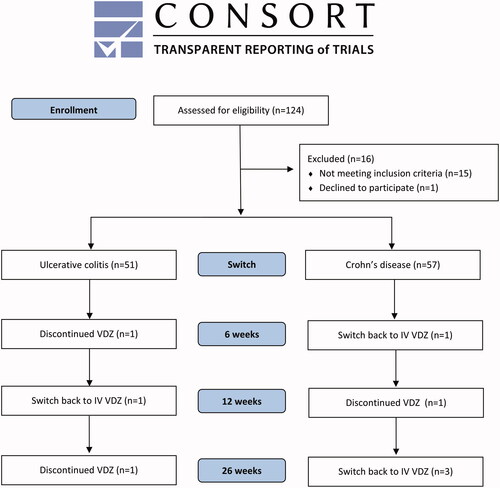
Table 2. Baseline characteristics of included patients.
Figure 2. Disease activity scores 26 weeks before, at switch, 6, 12 and 26 weeks after switching from intravenous to subcutaneous vedolizumab (VDZ). For Crohns’s disease (CD), each column represents proportions of patients classified according to the Harvey-Bradshaw Index (HBI): remission (HBI 0–4), mild disease (HBI 5–7), moderate disease (HBI 8–15), severe disease (HBI > 16). For ulcerative colitis (UC), each column represents proportion of patients classified according to the Partial Mayo Score without physician’s assessment (PMS): remission (PMS 0–1), mild disease (PMS 2–4) and moderate disease (PMS 5–6).
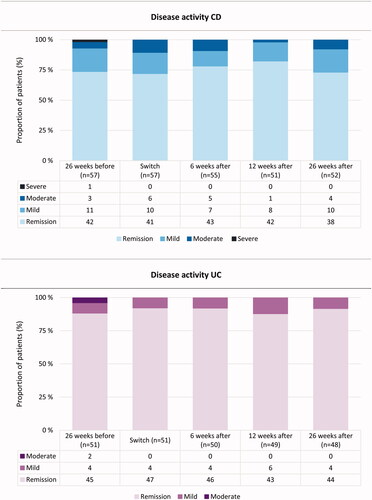
Figure 3. Serum-Vedolizumab (s-VDZ) concentration profile (mean, 95% CI) at the different time-points during the study.
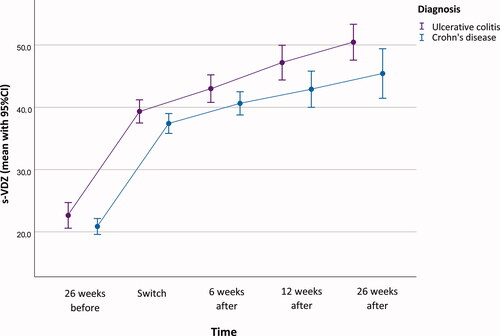
Figure 4. Inflammatory markers before and after switch. The columns represent the proportion of patients (%) with (i) C-reactive protein (CRP) below or above/equal to 5 mg/L, (ii) fecal calprotectin (FC) below or above/equal to 250 mg/kg, and (iii) anemia estimated by Hemoglobin (Hgb) according to the definitions from the World Health Organization.
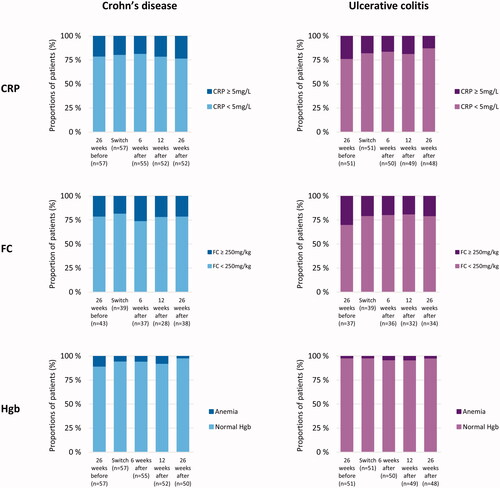
Table 3. Mixed models for repeated measure analyses.
Table 4. Adverse events reported during the follow-up period of six months (n = 108).
Figure 5. Patients’ preference when asked before administration of first subcutaneous injection (n = 107) and at 26 weeks follow-up (n = 96), p < 0.001.
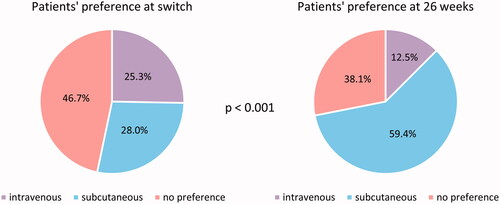
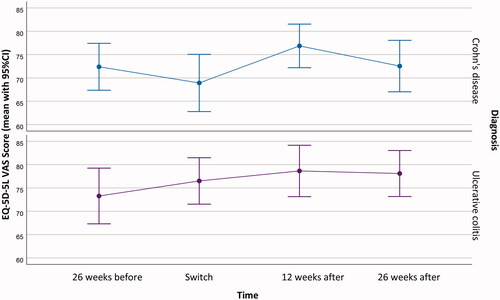
Figure 6. EQ-5D-5L visual analog scale (VAS) score (mean, 95% CI) at different time points of the study from switching to 26 weeks.
Data availability statement
The data underlying this article will be shared on reasonable request to the corresponding author.