
Figures & data
Figure 1. Flowchart of included patients. The outpatient group included 284 patients, from which the protein discovery cohort (n = 172) was derived from. The remaining patients in the outpatient group were combined with patients from the liver resection group to form the protein verification cohort (n = 160)*. Lastly, the protein verification cohort was divided into a training set and a validation set. *19 patients (9 HCC and 10 cirrhosis) from the protein discovery cohort were also included in the protein verification cohort.
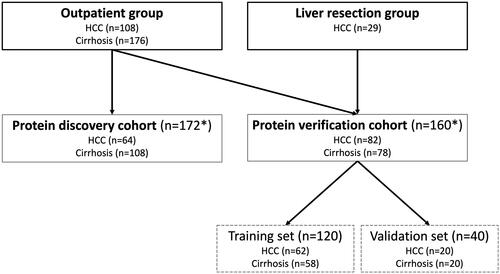
Table 1. List of the 20 proteins with the highest fold-change in plasma levels in patients with HCC compared to those with cirrhosis. The proteins are sorted by decreasing values of fold-change in the SBA and PEA platforms, respectively.
Table 2. Clinical and laboratory data of patients in the protein verification cohort (n = 160).
Table 3. Plasma levels of the analyzed protein biomarkers in patients with HCC and cirrhosis respectively, in the protein verification cohort (n = 160).
Table 4. The AUC values of the two-, three- and four-protein combination with the highest AUC in the cut-off model employed on the training set (n = 120), with values of the validation set (n = 40) shown in parenthesis. The panel to the right shows the AUCs when sex and age are included in the model.
Figure 2. ROC curves for the combined score using the logistic regression method. The combination of DCP and AFP yielded an AUC of 0.844 (a). Addition of TXNRD1 increased the AUC to 0.878 (b), while addition of sex and age increased the AUC to 0.914 (c). The highest AUC (0.920) was achieved when all parameters were combined (d).
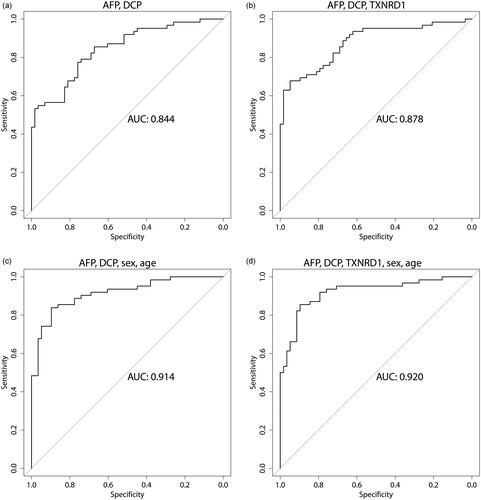
Table 5. The AUC values of different protein combinations in the logistic regression model employed on the training set (n = 120), with values of the validation set (n = 40) shown in parenthesis. The panel to the right shows the AUCs when sex and age are included in the model. AFP and DCP are included in every multiprotein combination being the proteins with the highest AUC, and with AFPL3%, FGF21 and TXNRD1 added in various combinations.
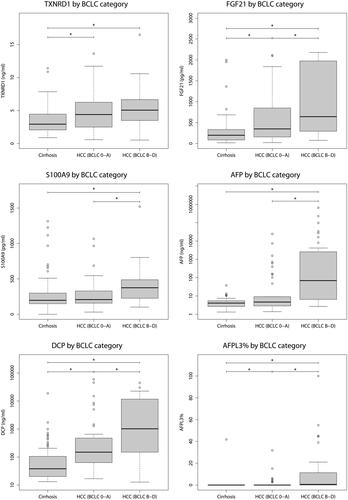
Figure 3. Plasma concentrations of proteins included in either the cut-off or log-reg models (AFP, DCP, TXNRD1, FGF21, S100A9 and AFPL3%) between patients with cirrhosis, early HCC (BCLC stage 0 or A) and advanced HCC (BCLC stage B to D). All proteins were significantly increased when comparing patients with cirrhosis to those with HCC BCLC stage B to D, but only AFPL3%, TXNRD1, FGF21 and DCP demonstrated a significant difference between patients with cirrhosis and early HCCs with BCLC stage 0 or A.
Supplemental Material
Download PDF (1.8 MB)Data availability statement
The data that support the findings of this study are available from the corresponding author upon reasonable request.