Figures & data
Table 1. Participant characteristics.
Figure 1. Urinary sodium excretion in 49 patients with an ileostomy, measured in a morning or midday spot urine sample. Circles indicate patients with end-ileostomy and complete small bowel, squares indicate patients with end-ileostomy after a previous pouch, and triangles indicate patients with end-ileostomy and ileal resections. Open marks indicate U-Na values ≤ 20 mmol/L, and closed marks indicate U-Na values >20 mmol/L. U-Na: urinary sodium.
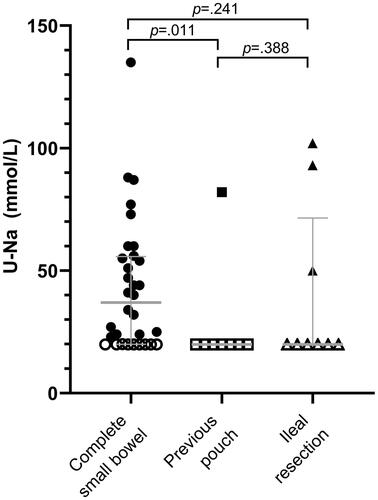
Table 2. Categorisation of patients with and without measurable natriuresis.
Figure 2. Comparison of paraclinical variables in patients with and without measurable natriuresis. Dotted lines indicate reference values. Circles indicate patients with end-ileostomy and complete small bowel, squares indicate patients with end-ileostomy after a previous pouch, and triangles indicate patients with end-ileostomy and ileal resections. Open marks indicate U-Na values ≤20 mmol/L, and closed marks indicate U-Na values >20 mmol/L. CO2: carbon dioxide; eGFR: estimated glomerulus filtration rate; BUN: blood urea nitrogen; P: plasma; U-Na: urinary sodium.
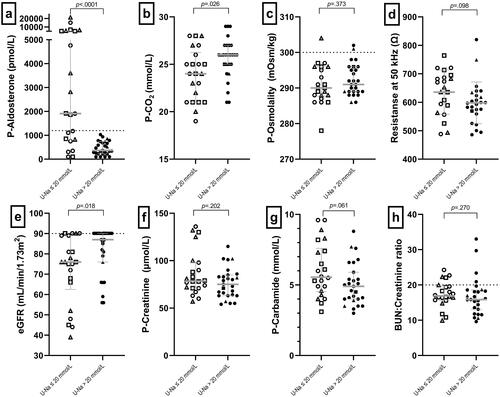
Figure 3. Correlations between different dehydration assessment methods. Resistance is an estimate of hydration (TBW) measured with bioelectrical impedance analysis. Grey marks are not included in the analysis. Circles indicate patients with end-ileostomy and complete small bowel, squares indicate patients with end-ileostomy after a previous pouch, and triangles indicate patients with end-ileostomy and ileal resections. Open marks indicate u-Na values ≤20 mmol/L, and closed marks indicate u-Na values >20 mmol/L. BUN: blood urea nitrogen; P: plasma; U-Na: urinary sodium; TBW: total body water.
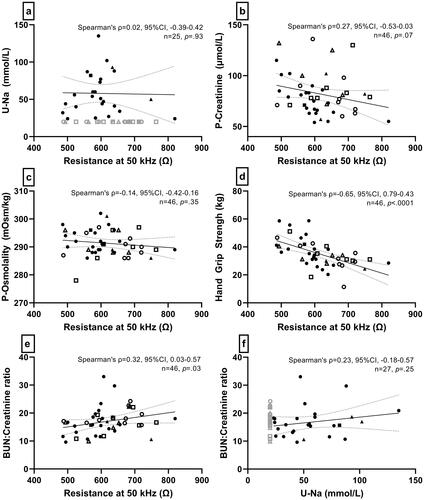
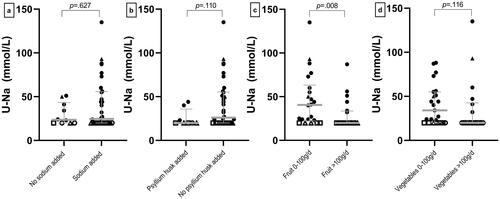
Figure 4. Dietary intake and association with urinary sodium. Comparison of patients with ileostomy who (a) added table salt to their diet or not, (b) ingested psyllium husks or not, (c) had an intake of fruit under or above 100 g/d and (d) had an intake of vegetables under or above 100 g/d. Circles indicate patients with end-ileostomy and complete small bowel, squares indicate patients with end-ileostomy after a previous pouch, and triangles indicate patients with end-ileostomy and ileal resections. Open marks indicate u-Na values ≤ 20 mmol/L, and closed marks indicate U-Na values >20 mmol/L. U-Na: urinary sodium excretion.