
Figures & data
Table 1. Characteristics of participants in the study at inclusion. Values are given as median (range) or n (%).
Figure 1. Flow-chart summarising the treatment and follow-up process of the study.
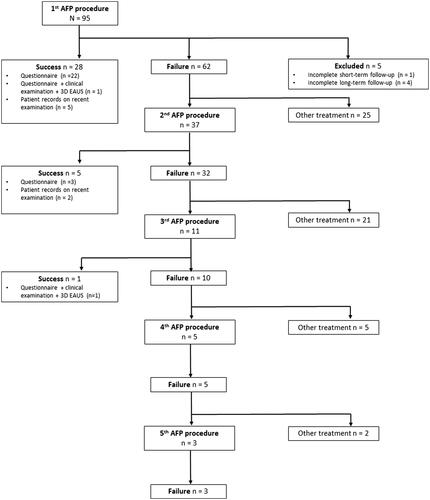
Figure 2. The visible fistula was noted as a hypoechogenic area (white arrow) at 3D EAUS in axial plane after the AFP procedure. IAS: internal anal sphincter.
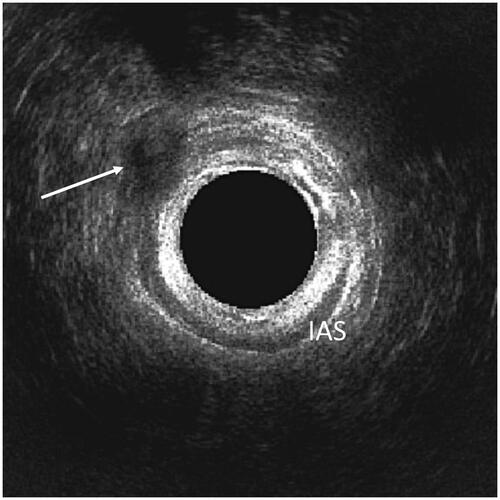
Figure 3. Inflammation was noted as a slightly hyperechogenic area (red arrow) at 3D EAUS in multiplanar reconstruction after the AFP procedure. Strongly hyperechogenic dots (white arrow) represent gas bubbles in the fistula tract. IAS: internal anal sphincter; PR: puborectalis muscle.
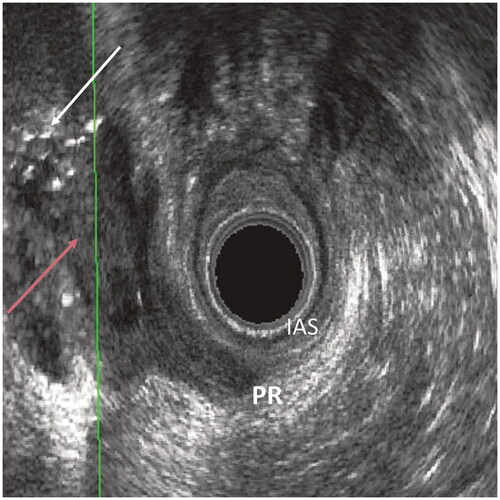
Table 2. The relevant 3D EAUS findings related to the results of the AFP procedure as identified in the long-term follow-up. Values are given as n(positive parameter)/n(plugs in group) and (%).
Table 3. Diagnostic probabilities for AFP failure based on 3D EAUS findings. PPV: positive predictive value; NPV: negative predictive value.
Table 4. Odds for AFP failure based on logistic regression model analysis of the relevant 3D EAUS findings. 95% CI = 95% Confidence Interval.
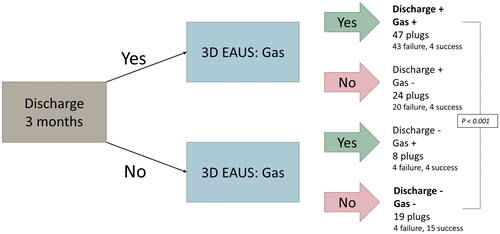
Figure 4. Result algorithm for the relationship between the clinical symptom of fluid discharge through the external fistula opening combined with the 3D EAUS parameter of gas in fistula 3 months after the AFP procedure analysed in relation to AFP failure for “the double positive” and “double negative” plugs (Fischer’s exact test, p < 0.001).
Data availability statement
Data is available on request due to privacy/ethical restrictions.