
Figures & data
Figure 1. Flow chart of patients with or without SVT secondary to SAP. SAP: severe acute pancreatitis; SVT: splanchnic vein thrombosis.
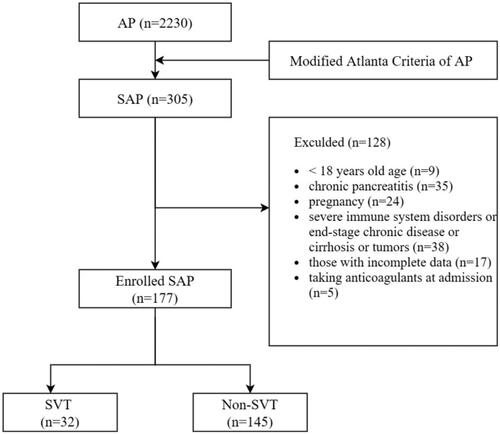
Table 1. Demographic characteristics and serum laboratory indicators of patients.
Table 2. Pattern of splanchnic vein thrombosis and anticoagulant therapy.
Figure 2. The area under the receiver operating characteristic (ROC) curve for predictive utility of D-Di and FDP for the presence of SVT in SAP are 0.8909 and 0.8578, respectively.
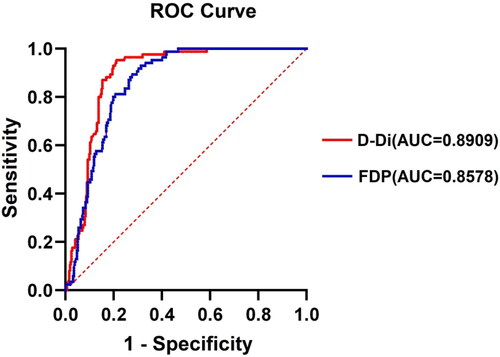
Table 3. The univariate analysis of coagulation and fibrinolysis markers.
Table 4. The binary logistic regression of coagulation and fibrinolysis markers.
Table 5. The predictive value of D-Di and FDP for SVT in SAP patients.
Table 6. Clinical Features and Outcome Between SVT and Non-SVT Group.
Data availability statement
The datasets analyzed during our study are available from the corresponding author upon reasonable request.