
Figures & data
Figure 1. Quantification of TNF mRNA levels in IBD tissue. Digital slides of the TNF mRNA ISH stained sections were submitted to colour segmentation-based image analysis. Original images with the TNF mRNA ISH signal (left) and corresponding colour classified images (right). Relative expression estimates were obtained as area fractions (red area/total area of ROI). Precision of the colour segmentation system at different signal intensities are shown here.
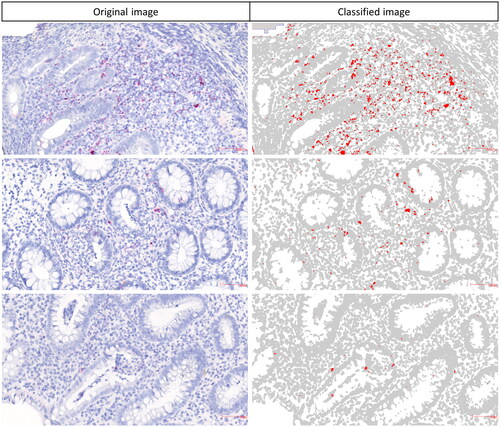
Table 1. Baseline characteristics of the IBD patient population.
Figure 2. TNF mRNA ISH in IBD colonic tissue. All tissue biopsies were collected before initiation of anti-TNF therapy. ISH for TNF mRNA was done using RNAscope technology and performed on tissue from the three response groups: responders, primary non-responders (PNR) and secondary non-responders (SLOR). The TNF mRNA signal (red stain) is seen in superficial lamina propria (SLP), deep lamina propria (DLP) and lymphoid follicles (LF). Tissue sections were counterstained with haematoxylin. The ISH images are representative for different response groups among adult IBD patient samples.
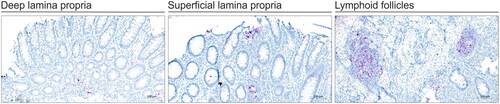
Figure 3. TNF mRNA ISH in adults and paediatric IBD colonic tissue. Examples of TNF mRNA ISH in the different response groups of adult and paediatric IBD patients. TNF mRNA expression (red stain) is shown in the lamina propria area. The examples suggest that, in adults, TNF expression is high in PNRs compared to responders and SLORs, moreover, in paediatric patients, a similar trend with high TNF expression in PNRs compared to responders and SLORs is noted. The examples also suggest that adults have higher TNF expression than paediatric patients. The TNF mRNA ISH signal was quantified using image analysis (see ).
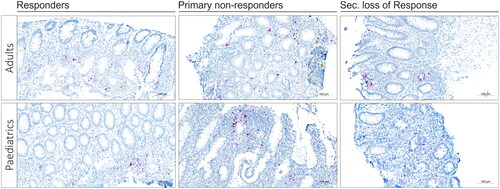
Figure 4. Relative TNF mRNA levels in IBD tissues with and without LF. TNF mRNA expression estimates from the ISH-stained slides were obtained in tissue areas with and without LF. All IBD patients included are divided into age groups (A and B) and response groups (C and D). Plots were made using ggstatsplot package from R. Each dot represents one patient.
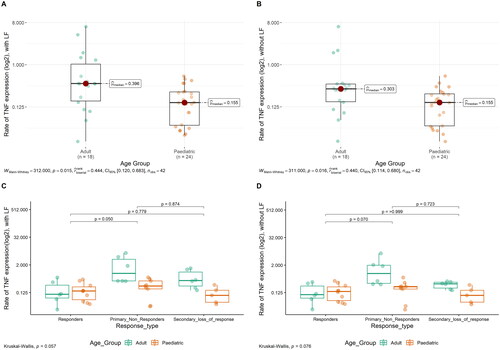
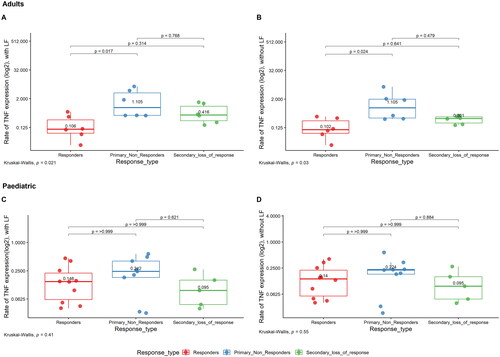
Figure 5. Relative TNF mRNA levels in adult and paediatric IBD tissue. TNF mRNA expression estimates from the ISH-stained slides were obtained in the whole tissue area. A + B presents. TNF expression for adults in the different response groups, with and without LF, respectively. C + D presents TNF expression in paediatric patients in different response groups, with and without LF, respectively. Each dot represents one patient.
Supplemental Material
Download PDF (195.1 KB)Data availability statement
The data underlying this article are available in the article and in its online supplementary material.