
Figures & data
Figure 1. Age group-specific incidence rates (IR) of gastric cancer (GCA) per 100 000 people in relation to birth cohorts (‘cohort effect’) and age groups (‘age effect’) in NORDCAN database among Finnish men born in 1900–1904 or later. The figure on the left shows the IRs in cohort groups born from 1900–1904 to1960–1964 and the figure on the right demonstrates the IRs in cohort groups born from 1940–1944 to 1980–1984.
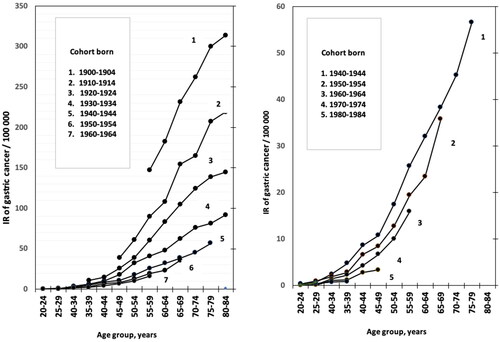
Figure 2. Age group–specific incidence rates (IR) of gastric cancer (GCA) per 100,000 people in relation to the period of GCA diagnosis (‘period effect’) and age groups (‘age effect’) in NORDCAN database in Finnish men born in 1900–1904 or later.
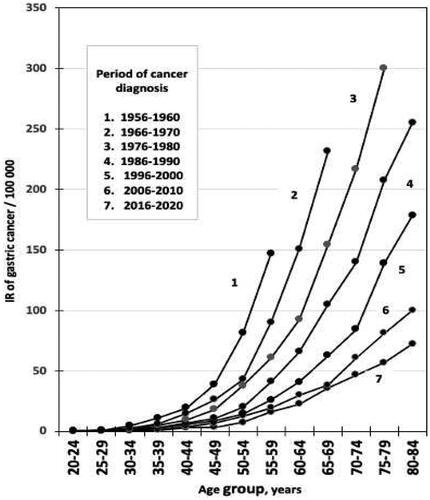
Figure 3. 3D–graph on age group specific incidence rates (IR) of gastric cancer (GCA) per 100,000 people in relation to birth cohort (‘cohort effect’) and age group (‘age effect’) in NORDCAN database in Finnish men born in 1900–1904 or later.
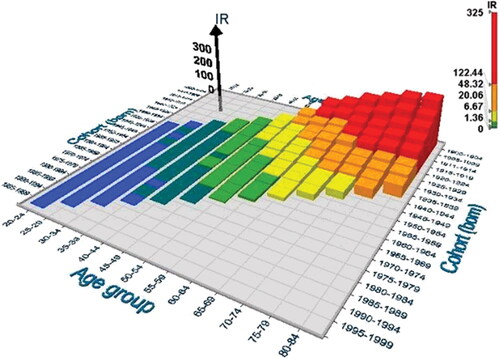
Figure 4. 3D–graph on the group specific incidence rates (IR) of gastric cancer (GCA) per 100,000 people in relation to period of GCA diagnosis (‘period effect’) and age group (‘age effect’) in NORDCAN database in Finnish men born in 1900–1904 or later.
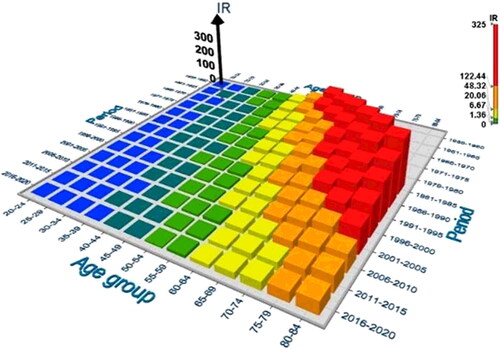
Table 1. Table on goodness of fit statistics of models tested by PLSR concerning observed IR of GCA as Y–variable and various combinations of age, cohort and period as explanatory X–variables. Observations from Finnish men.
Figure 5. Standardized regression coefficients (with 95%CI) in PLSR with ln(IR) data of GCA as a quantitative response parameter and the consecutive 5–year categories of calendar age (‘age effect’), birth cohort (‘cohort effect’) and period (‘period effect’) of GCA diagnosis as explanatory variables without any interaction terms. Finnish men.
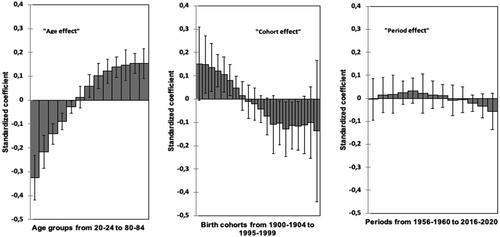
Figure 6. Fit between the observed and predicted (estimated) ln(IR)s of GCA per 100 000 Finnish men and women in PLSR modelling (option [1] in ).
![Figure 6. Fit between the observed and predicted (estimated) ln(IR)s of GCA per 100 000 Finnish men and women in PLSR modelling (option [1] in Table 1).](/cms/asset/07290529-0b4e-4d4c-95f0-de9e1e578af4/igas_a_2220858_f0006_c.jpg)
Table 2. Annual observed and PLSR–precited incidence rates (IR) of GCA per 100 000 people in 5–year categories of birth cohorts and age groups among native men born in Finland in 1900–1904 or later.