Figures & data
Table 1. Demographic characteristics of the MC cohort.
Figure 1. (a) MC, (b) CC and (c) LC. Age-specific rate per 100,000 person-years with 95% confidence interval in microscopic colitis, collagenous colitis and lymphocytic colitis, respectively.
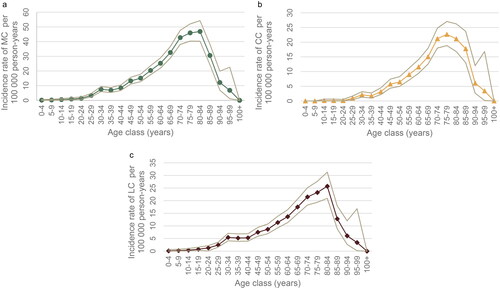
Figure 2. (a) Women and (b) men. Age-standardized rate per 100,000 person-years in collagenous colitis and lymphocytic colitis during the period 2010–20 in women and men, respectively.
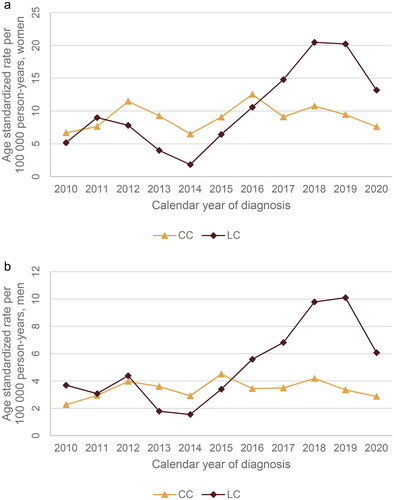
Figure 3. Age-standardized rate per 100,000 person-years for collagenous colitis and lymphocytic colitis with 95% confidence interval during the period 2010–2020.
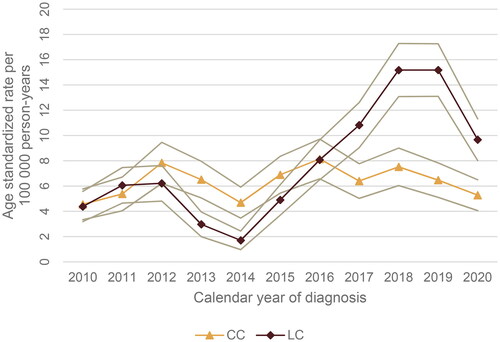
Table 2. Cases with MC, CC and LC divided into three main categories based on population concentration.
Figure 4. Age-standardized rate per 100,000 person-years during the period 2010–20 divided in the 33 municipalities in Skåne.
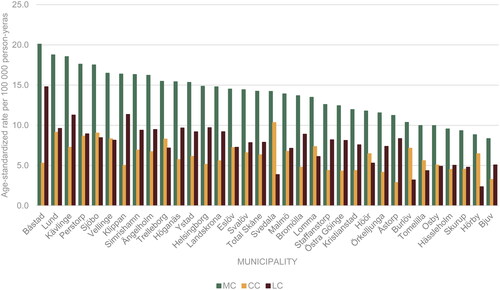
Figure 5. Age-standardized rates per 100,000 for lymphocytic colitis 2015–2020, illustrating the variation in incidence between different parts of Skåne.
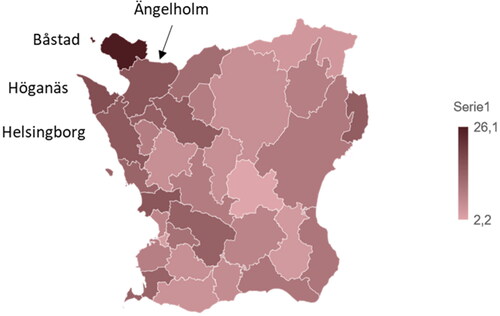
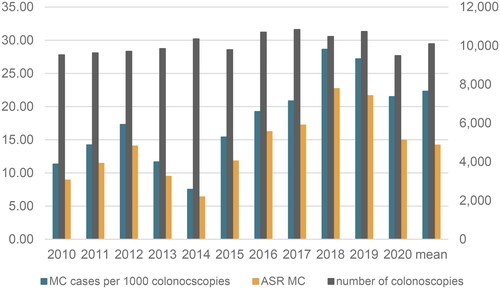
Figure 6. Cases of microscopic colitis per 1000 colonoscopies with biopsies in Skåne in relation to age-standardized rate per 100,000 person-years of microscopic colitis 2010–2020.