
Figures & data
Figure 1. A. Heatmap of differentially expressed genes. The top ten up-regulated and down-regulated genes are shown in red and green, respectively. B and C. Volcano map analysis of differentially expressed mRNA (B) and lncRNA (C) respectively: red indicates that the gene is highly expressed in the sample, and green is low in the sample.
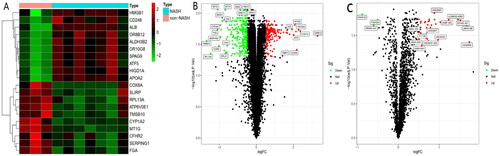
Figure 2. ceRNA network diagram of LINC00207-microRNA-761-HIGD1A. The connection of any two genes in the network represents the interaction between the two, where blue represents LncRNA, green represents microRNA and red represents mRNA.
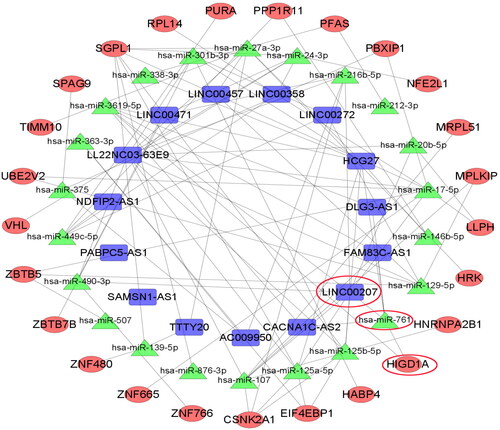
Figure 3. HIGD1A expression is elevated under high-fat exposure. qRT-PCR (A) revealed that HIGD1A expression was not increased when HepG2.2.15 cells were exposure to different concentration of OA and palmitate, however, western blot (B) revealed that HIGD1A expression was increased significantly upon exposure to 0.8 mM OA and 0.4 mM palmitate for 96 h in HepG2.2.15 cells. Meanwhile, qRT-PCR (C) and western blot (D) also shown that HIGD1A expression in liver tissue was higher significantly in NASH group than non-NASH group of mice (# p < 0.05 compared with non-NASH group).
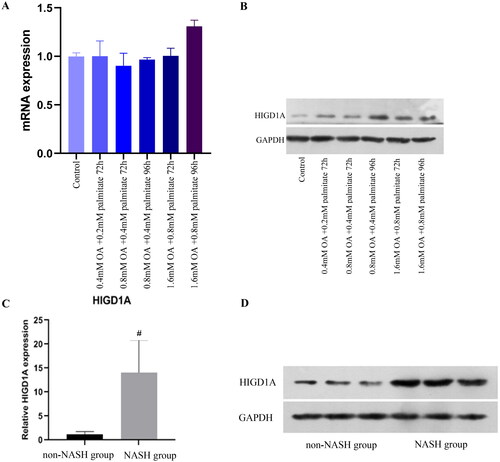
Figure 4. Quantification of HIGD1A staining in liver tissue of patients. (∗p < 0.05 compared with non-NASH group,# p < 0.05 compared with portal area group).
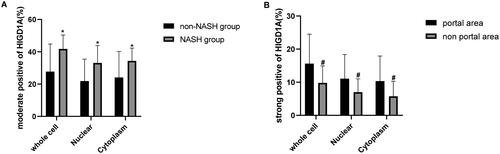
Figure 5. Overexpression of HIGD1A protects cells from apoptosis under high-fat exposure and vice versa. cells in the FFA + pcDNA HIGD1A + siRNA NC group exhibited increased HIGD1A expression compared with those in the FFA + pcDNA NC + siRNA NC group and cells in the FFA + pcDNA NC + siRNA HIGD1A group exhibited decreased HIGD1Aexpression compared with those in the FFA + pcDNA NC + siRNA NC group in HepG2.2.15 cells (a). cell proliferation in each group was measured by the MTT kit in HepG2.2.15 cells (B), and cell apoptosis in each group was measured by flow cytometry using Annexin V-FITC staining in HepG2.2.15 (C) (∗p < 0.05 compared with the FFA + pcDNA NC + siRNA NC group).
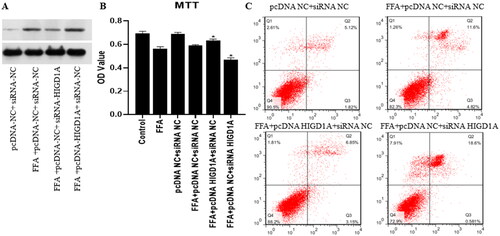
Figure 6. Overexpression of HIGD1A protects mitochondrial transmembrane potential under high-fat exposure and vice versa. The impairment of MMP was less severe in the FFA + pcDNA HIGD1A + siRNA NC group compared with the FFA + pcDNA NC + siRNA NC group, and the impairment of MMP was more severe in the FFA + pcDNA NC + siRNA HIGD1A group compared with the FFA + pcDNA NC + siRNA NC group in HepG2.2.15 cells.
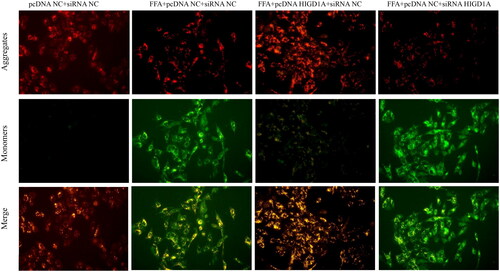
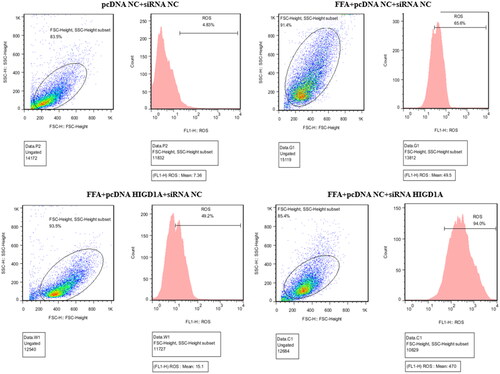
Figure 7. Overexpression of HIGD1A alleviates hepatic ROS under high-fat exposure and vice versa. The intracellular ROS was significantly elevated in FFA groups than control group (pcDNA NC + siRNA NC group). The intracellular ROS of FFA + pcDNA HIGD1A + siRNA NC group was lower compared with the FFA + pcDNA NC + siRNA NC group, and the intracellular ROS of FFA + pcDNA NC + siRNA HIGD1A group was higher compared with the FFA + pcDNA NC + siRNA NC group in HepG2.2.15 cells.
Supplemental Material
Download Zip (15.4 MB)Data availability statement
All data generated or analysed during this study are included in this article. Further enquiries can be directed to the corresponding author.