
Figures & data
Table 1. Characteristics of patients included in the study at baseline.
Figure 1. Response rates of females and males to FMT in the total patient cohort (A) and in the LI (B), SI (C) and R (D) groups. ns, not significant.
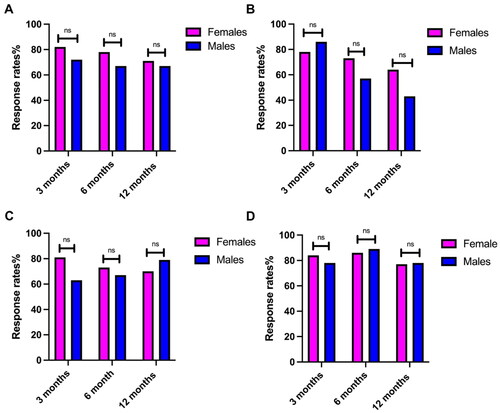
Figure 2. Total IBS-SSS scores in females and males in the total patient cohort (A) and in the LI (B), SI (C) and R (D) groups. *, p < 0.05.
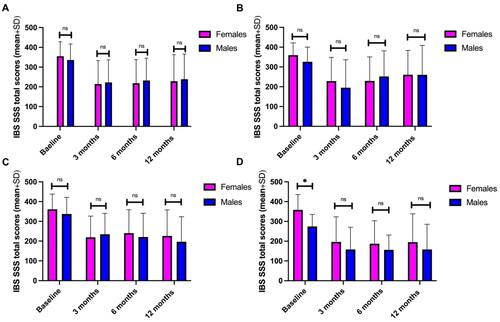
Figure 3. Birmingham IBS Symptom Questionnaire total scores for females and males in the total patient cohort (A) and in the LI (B), SI (C) and R (D) groups. *, p < 0.05; **, p < 0.01.
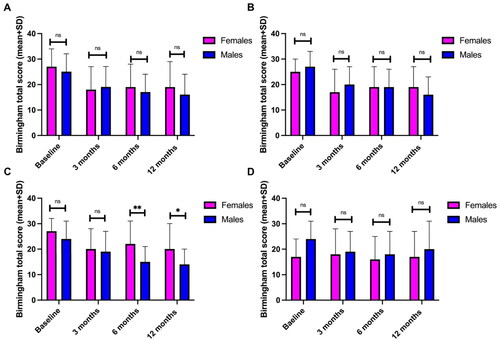
Figure 4. FAS total scores for females and males in the total patient cohort (A) and in the LI (B), SI (C) and R (D) groups.
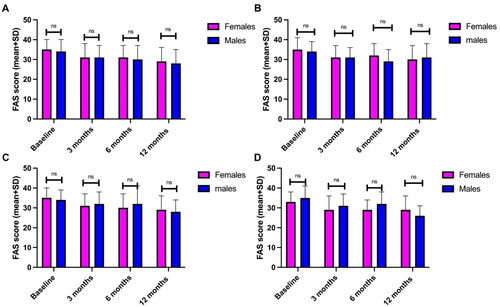
Figure 5. Total IBS-QoL scores in females and males at different times after FMT in the total patient cohort (A) and in the LI (B), SI (C) and R (D) groups. *, p < 0.05; **, p < 0.01.
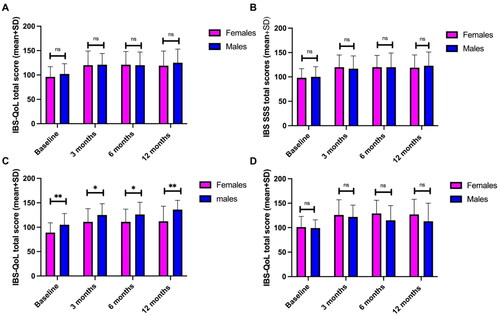
Figure 6. Total SF-NDI scores in females and males at different times after FMT in the total patient cohort (A) and in the LI (B), SI (C) and R (D) groups.
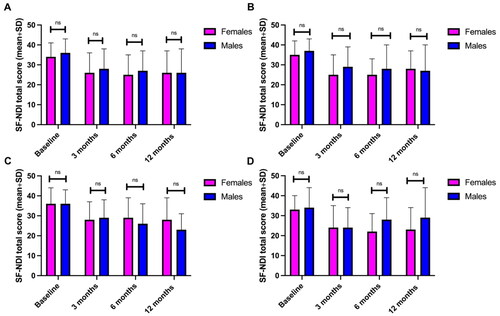
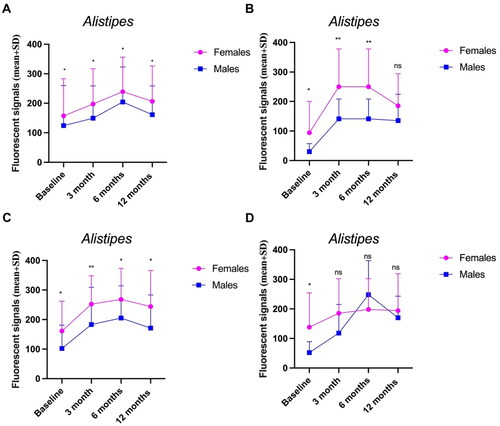
Figure 7. Levels of Alistipes spp. in females and males at baseline and at different times after FMT in the total patient cohort (A) and in the LI (B), SI (C) and R (D) groups. *, p < 0.05; **, p < 0.01.
Supplemental Material
Download MS Word (251.5 KB)Data availability statement
Data obtained in this study are available from the corresponding author on request.