
Figures & data
Figure 1. Flowchart of the data formation (excluded data, blue boxes) and analyses (grey boxes). CVC, Central venous catheter; HUS, Hospital District of Helsinki and Uusimaa;, * = any symbol.
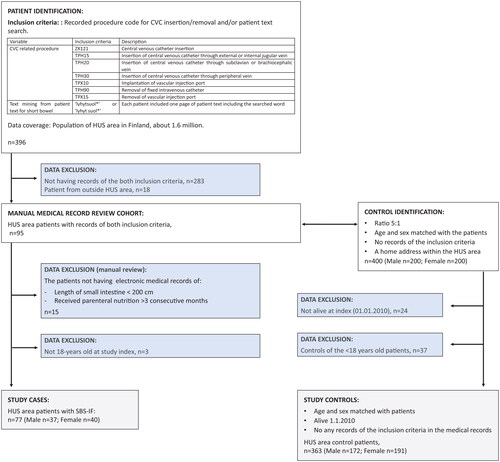
Table 1. Demographic and clinical characteristics. Small patient groups (<5 patients) have not been reported in detail. Occurrence of septicaemia was not studied in controls.
Figure 2. Cumulative total expenses of hospital-based healthcare resource use (hospitalizations and outpatient clinic contacts) in cases (red) and controls (blue) per year starting one year prior to index.
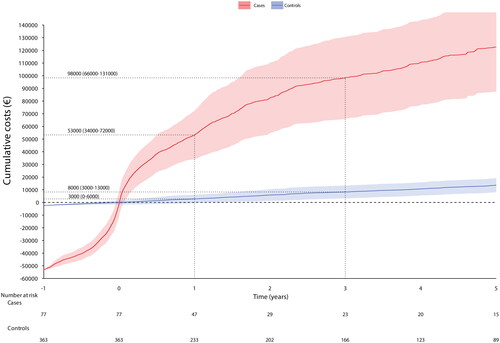
Figure 3. Cumulative number of (A) inpatient days and (B) clinic contacts in cases (red) and controls (blue) per year.
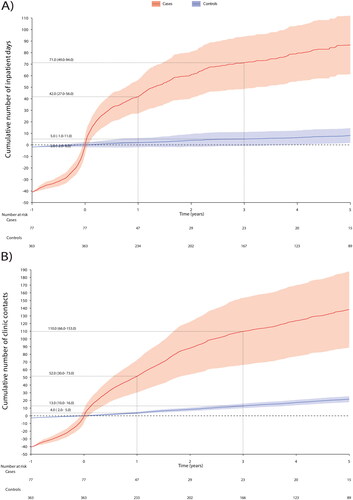
Figure 4. The Kaplan–Meier overall survival from (A) all cases and controls (no stratification), by Charlson comorbidity index (B) cases and (C) controls, by age group (D) cases and (E) controls, by cancer status (F) cases and (G) controls. A person was defined having prevalent cancer if they were recorded with any cancer diagnosis code starting with C* excluding C44 (non-melanoma skin cancer).
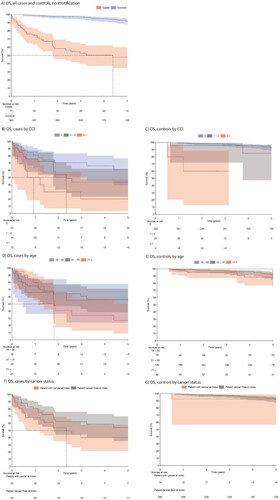
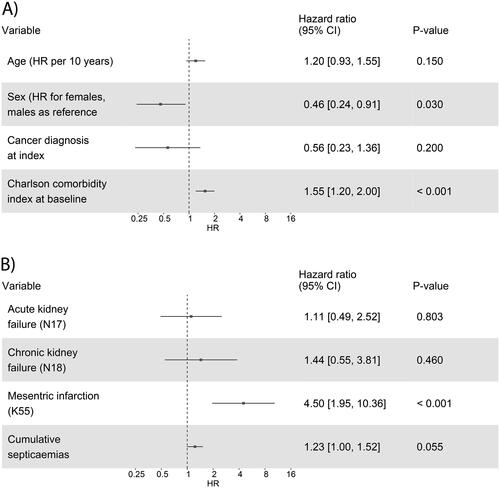
Figure 5. Cox multivariable fit models for association of (A) age, sex, cancer diagnosis, and Charlson comorbidity index, and (B) acute and chronic kidney failure, mesenteric infarction, and cumulative septicaemia with overall survival, adjusted by age, sex, and cancer status. The hazard ratios (HR), 95% confidence intervals (CI), and p-values are reported.
Supplemental Material
Download MS Word (1.1 MB)Data availability statement
The original data were obtained from the Hospital District of Helsinki and Uusimaa (HUS). Data can be acquired with data permission by following the guidance and application process of the registry. All authors had access to the pseudonymized aggregate data, whereas pseudonymized single-level registry data were available only to authors who analyzed the data. Only the personnel of the registry had full access to patient data.