
Figures & data
Figure 1. Flow chart of patients – subject disposition.
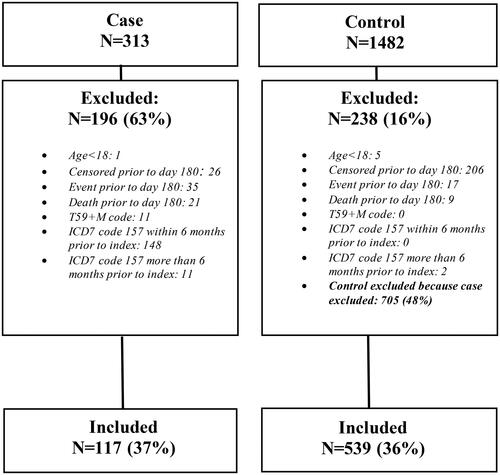
Figure 2. Number of cases (IPMN) per calendar year. IPMN: intraductal papillary mucinous neoplasm.
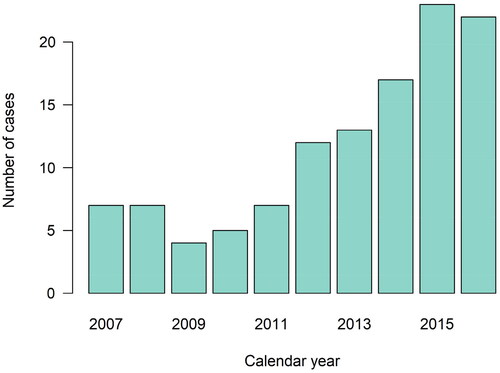
Table 1. Baseline characteristics of study cohort.
Table 2. Description of events (GI cancer precursors) among the study population.
Figure 3. Cumulative incidence curves for GI precursor lesions and all-cause mortality in patients with IPMN compared to controls. IPMN: intraductal papillary mucinous neoplasm; GI: gastrointestinal.
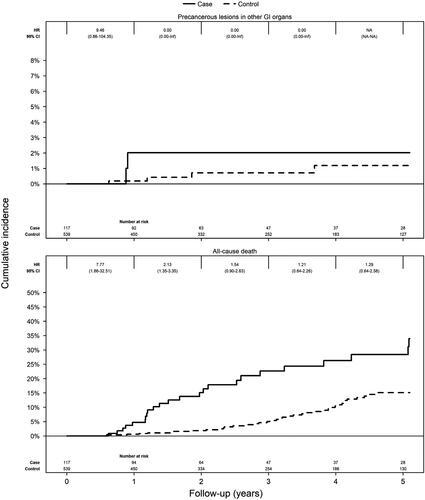
Table 3. Risk of all-cause and cause-specific mortality in patients with IPMN and matched general population comparators (Cox model).
Table 4. Description of deaths among the study population.
Supplemental Material
Download MS Word (15.3 KB)Data sharing statement
Other researchers can apply for our data through the different Swedish pathology departments, and through the Swedish National Board of Health and Welfare.