
Figures & data
Table 1. Demographics of patients from care pathway analysis.
Figure 1. Average waiting times.
Legend: MRE: magnetic resonance enterography; IUS: intestinal ultrasound; SD: standard deviation
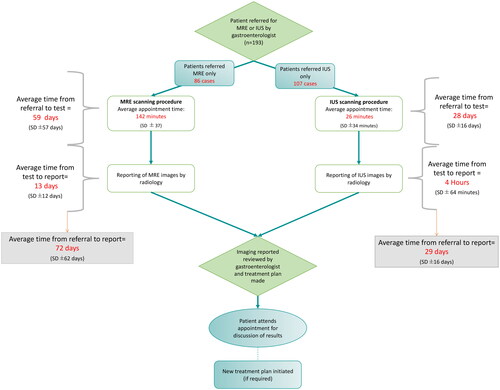
Table 2. Proportion and number of patients with treatment changes.
Table 3. Healthcare interaction costs.
Table 4. Estimated costs per patient (£, GBP).