
Figures & data
Figure 1. Circulating plasma levels of activin A in patients according to the (a) fibrosis stage (F0-2, n = 30; F3-4, n = 11), (b) steatosis grade (0, n = 1; 1, n = 12; 2, n = 10; 3, n = 16), (c) ballooning grade (0, n = 33; 1, n = 6) and (d) lobular inflammation grade (0, n = 36; 1, n = 3). (e) Circulating plasma levels of activin A in patients with PNPLA3 wild type (w.t) or heterozygote C/G allele (n = 33) compared to patients with the homozygote G/G allele (n = 5). * for p < 0.05, *** for p < 0.001. Data are presented as individual values and medians. (f) Receiver Operating Characteristic (ROC) curve demonstrating the performance of FIB-4 and Activin A in detecting the presence of advanced fibrosis. Activin A AUROC = 0.836 and FIB-4 AUROC = 0.839.
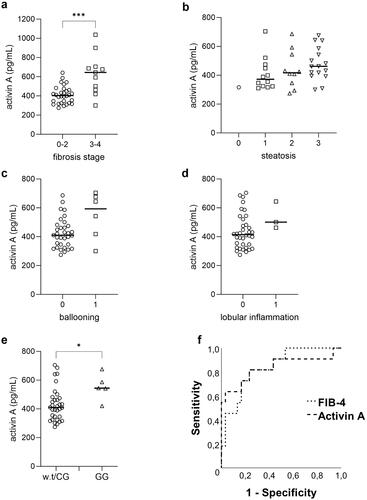
Table 1. Univariate and multivariate logistic regression analysis. Evaluation of predictors of advanced fibrosis in MASLD.