Figures & data
Figure 1. Patient selection in a flow diagram.
BC: brush cytology, EUS: endoscopic ultrasound, ERCP: endoscopic retrograde cholangiopancreatography, FNA: fine needle aspiration.
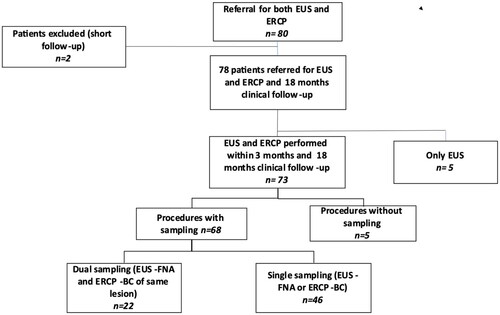
Table 1. The study’s baseline characteristics.
Table 2. The final diagnoses.
Table 3. The Laboratory results in relation to the final diagnosis.
Figure 2. Sensitivity, specificity, NPV, PPV, and accuracy of the different diagnostic modalities in patients undergoing combined EUS-ERCP (n = 73). This is the per-protocol analysis.
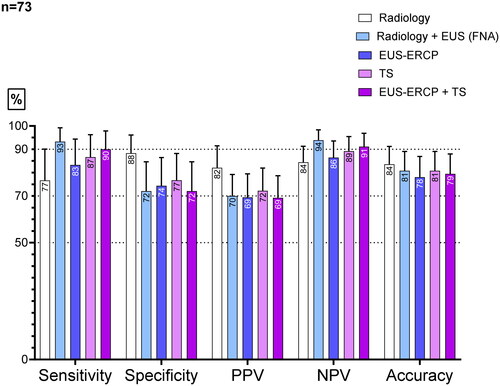
Figure 3. Sensitivity, specificity, NPV, PPV, and accuracy of the different diagnostic modalities in all the included patients referred for EUS-ERCP (n = 78). This is the intention-to-diagnose analysis (ITD analysis).
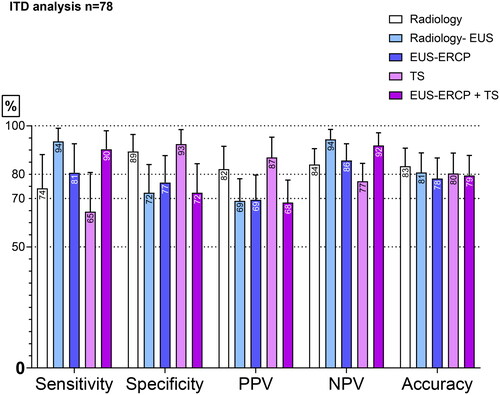
Figure 4. A comparison of the diagnostic performance in PSC patients undergoing EUS-ERCP (n = 24). Brush cytology (BC); tissue sampling (TS).
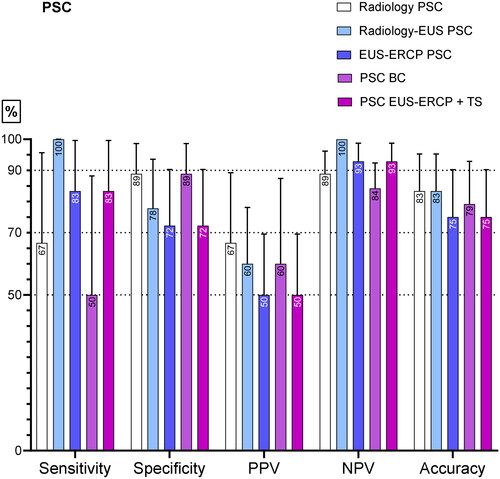
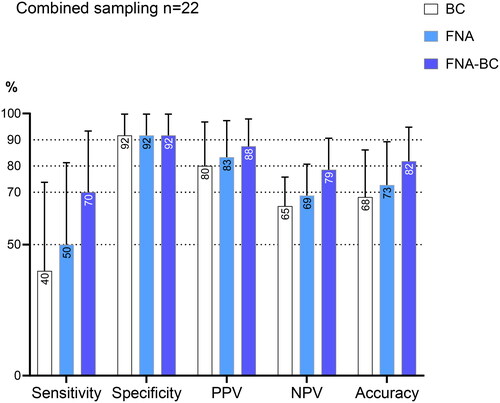
Figure 5. Results of different types of tissue sampling in patients undergoing EUS-ERCP with both FNA and brush cytology (BC) (n = 22).