
Figures & data
Figure 1. Study flow chart demonstrating defined cohort of patients with conservatively treated acute appendicitis.
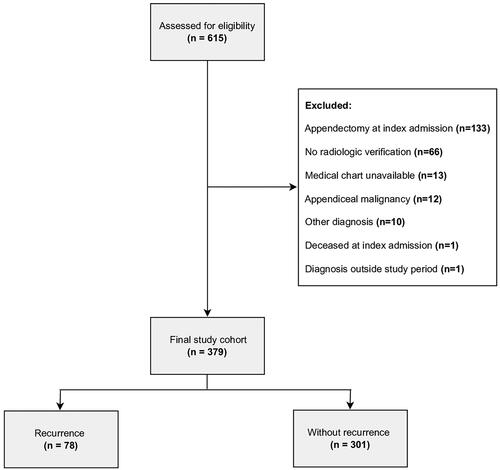
Table 1. Characteristics of study cohort at index admission.
Figure 2. Kaplan–Meier curve representing time to recurrence one year after conservatively treated acute appendicitis.
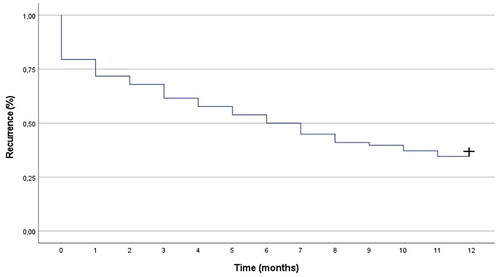
Figure 3. Receiver operating characteristic (ROC) curve representing the predictive ability of the multivariable logistic regression model.
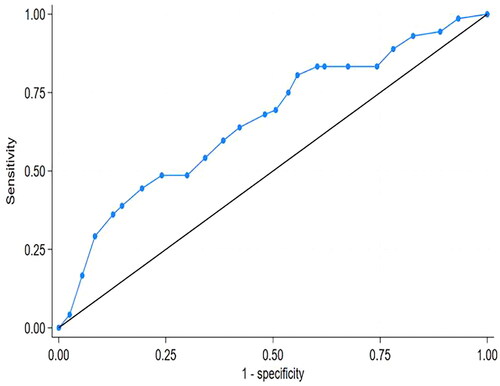
Table 2. Univariable and multivariable logistic regression for prediction of recurrent acute appendicitis.