
Figures & data
Figure 1. Political activities of primary leaders across religious traditions.
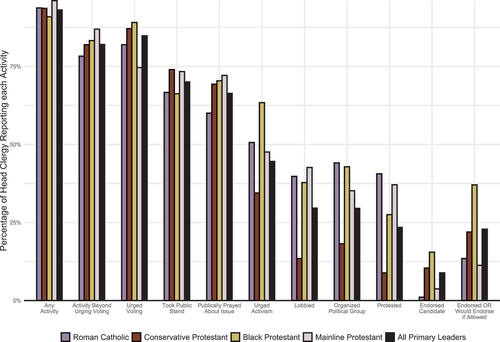
Figure 2. Political issues addressed by clergy across religious tradition.
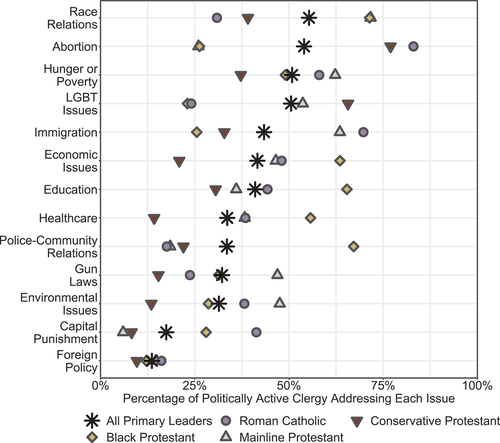
Figure 3. Fit of LCA models.
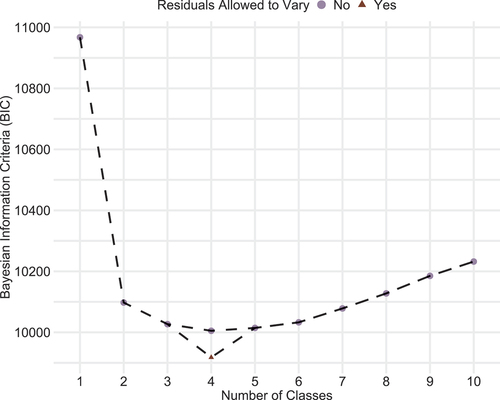
Figure 4. Estimated probabilities of addressing each issue for clergy categorized as pursuing each agenda.
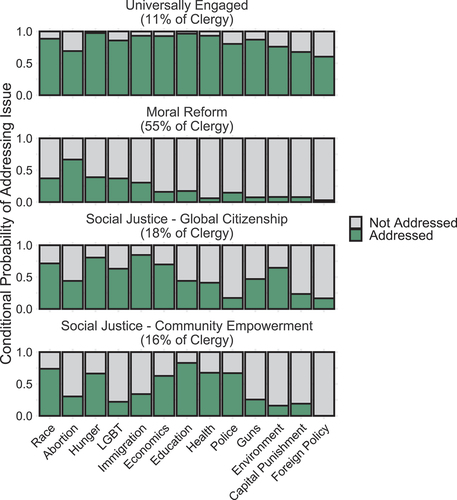
Figure 5. Prevalence of political agendas within religious traditions.
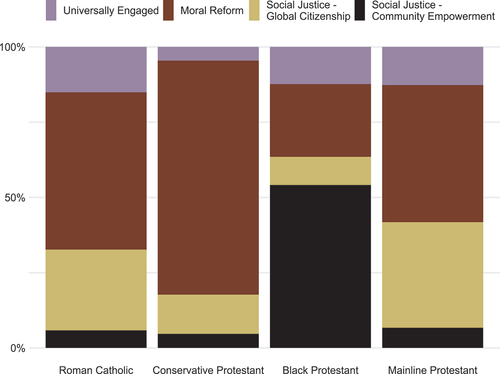
Table A1. Percentages of Head Clergy Engaging in Political Activities
Table A2. Percentages of Politically Active Head Clergy Addressing Each Issue in Their Activism
Table A3. Fit Statistics of LCA Models
Table A4. Estimated Probabilities of Addressing Each Issue for Clergy Categorized As Pursuing Each Agenda
Table A5. Distribution of Politically Active Clergy Across Political Agendas, by Religious Tradition
