Figures & data
Figure 1. Dye injection system for pot (a) and field (b). (a) a, Two dry treatments with low-pressure injection system; b, two wet treatments with high-pressure injection system; c, Y-type connector; d, two-way stopcock; e, plastic pipette; f, dye (Fantasy); g, stem tube; h, wire; i, pot; j, pesticide sprayer; k, regulator; l, gas tank; m, pressure- tolerant tube; n, stand. (b) o, Hose band.
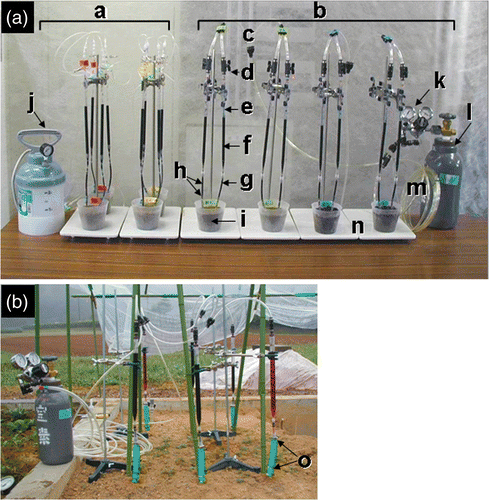
Figure 2. Pipette and stem tube: a, pipette 50 mL volume; b, pipette and connector; c, pipette 10 mL volume; d, tube connectors in stem tube; e and f, stem tubes with hose band for thick stem; g and h, stem tubes for thin stem.
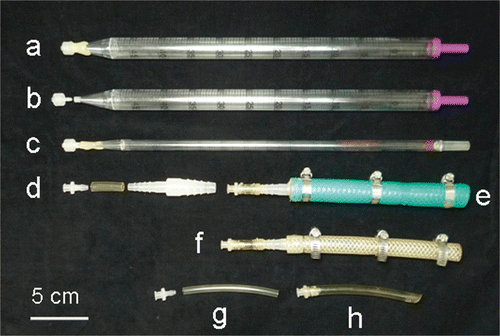
Figure 3. Root staining and sampling methods in field-grown tomatoes 159 and 170 days after sowing (DAS). Row S corresponds to the south position, row N corresponds to the north position, R is red, G is green, L is lavender, B is blue and W is white (no dye).
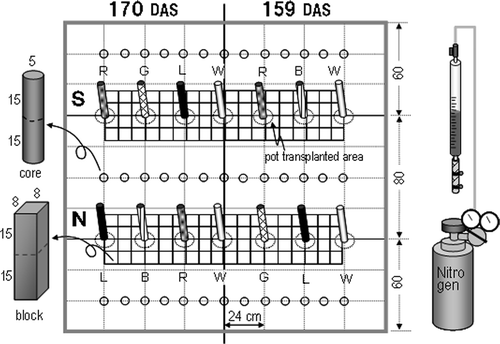
Figure 4. Relationship among dye consumption, soil moisture content and injection pressure in roots of pot-grown tomatoes 100 days after sowing. Results are expressed as means of two pots ± standard deviation (bars). Values following legends indicate percentage of maximum water holding capacity. Injection pressure was 0.05 MPa initially in all treatments. In both 68% and 86% treatments, the pressure was increased to 0.5 MPa at 6 h (indicated by an arrow).
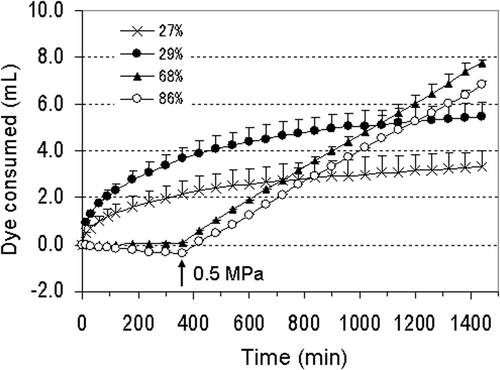
Table 1. Relationship between soil moisture content and root staining condition in pot experiment 100 days after sowing†
Figure 5. Percent root length of each soil block and core in field-grown tomatoes 170 days after sowing. Each bar or pie graph is arranged to correspond to the sampling position. The colors of the graphs correspond to the dye colors. The circles with letters in the graphs indicate positions of the hills and the dye colors. Row S corresponds to the south position, row N corresponds to the north position. R is red, G is green, L is lavender, B is blue and W is white (no dye).
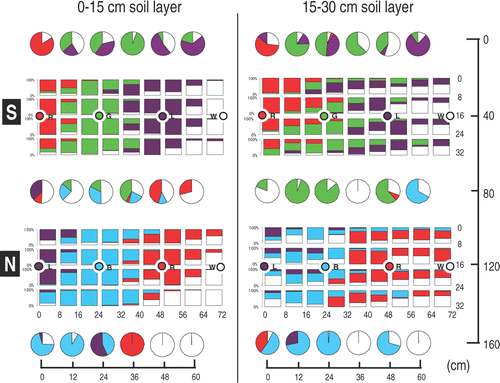
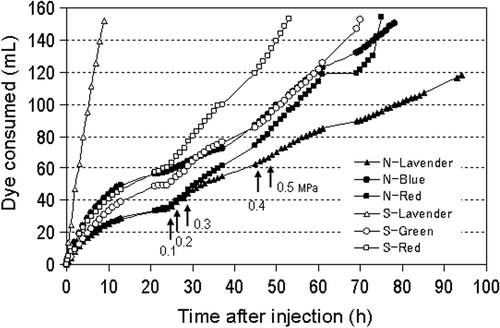
Figure 6. Relationship between dye consumption and injection pressure in each tomato plant in field (170 days after sowing). The injection pressure was 0.05 MPa initially. Arrows with figures indicate changing points of the pressure (MPa). The symbol S corresponds to the south position, N corresponds to the north position.