Figures & data
Figure 1. Total nitrogen (N) and uric acid-N contents of litters collected from two different layer chicken farms (Farm A and B) in different diets (CP17, 17.5 and 18%). Error bars represent standard deviations of mean.
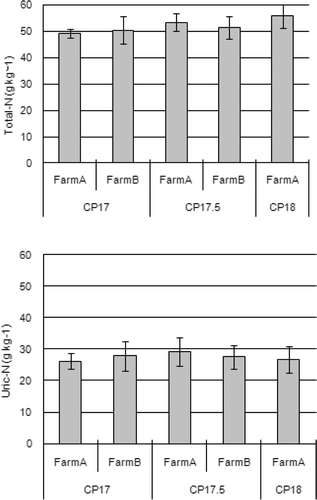
Figure 2. Total nitrogen (T-N) and uric acid N (U-N) contents of litters from different growth stages. Error bars represent standard deviations of mean.
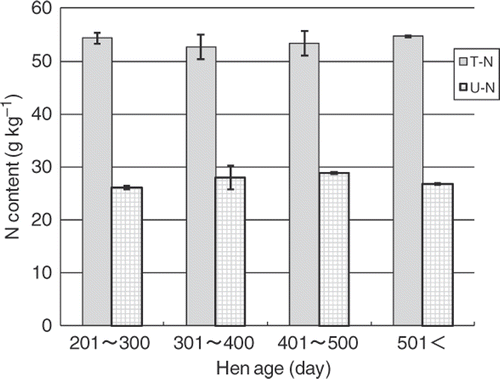
Figure 3. Uric acid nitrogen (N) content of litters with different water contents as a function of incubation period. Error bars represent standard deviations of mean.
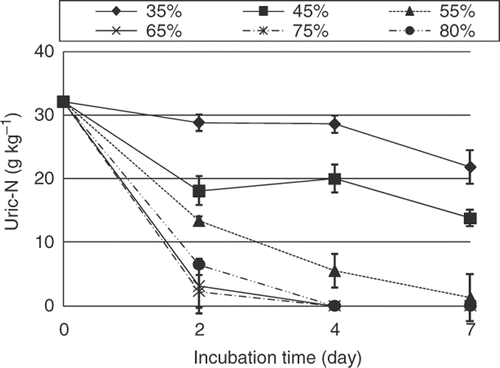
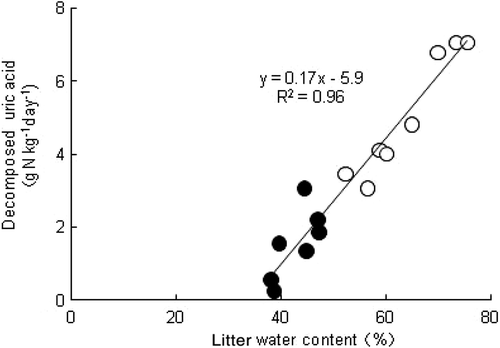
Figure 4. The amount of decomposed uric acid in litters as a function of water content. Open and filled circles represent samples collected from open-floor houses and windowless houses, respectively.