Figures & data
Figure 1. Experimental paddy plots. DBP, days before ponding.
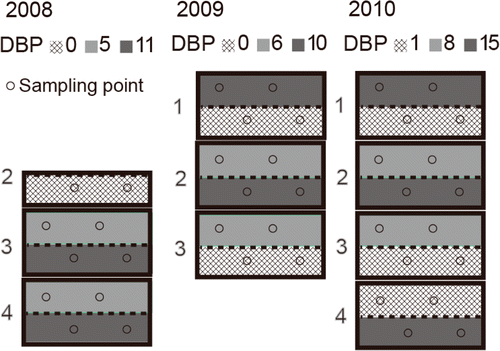
Table 1. Applications of digested liquid and cultivation practices
Table 2. Components of methane fermentation liquid for application (mg NL−1)
Figure 2. Climate changes for crop seasons over 3 years. DAP, days after ponding; TP, transplanting; PFS, panicle formation stage; AA, additional application; EES, ear emergence stage.
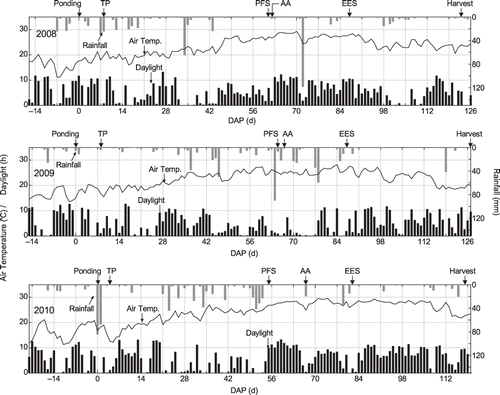
Figure 3. Temporal changes in nitrogen (N) concentrations in soil before transplanting. The symbols and error bars indicate the average and standard deviation of sub-plots (2 sampling points), respectively. DAP; days after ponding; DBP, days before ponding; TP, transplanting; DON, dissolved organic nitrogen. *Denotes significant differences in each sub-plot.
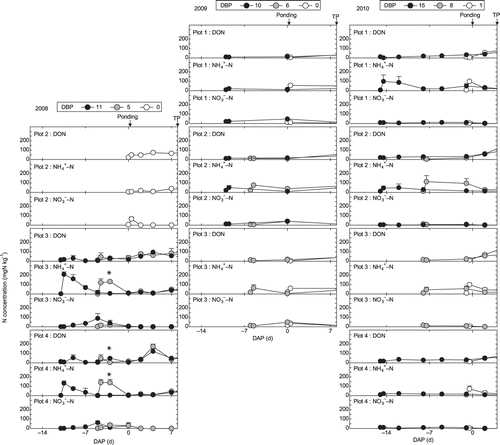
Figure 4. Temporal changes in nitrogen (N) concentrations in soil from transplanting to additional application. The symbols and error bars indicate the average and standard deviation of sub-plots (2 sampling points), respectively. DAP, days after ponding; DBP, days before ponding; TP, transplanting; AA, additional application; PFS, panicle formation stage; DON, dissolved organic nitrogen. *Denotes significant differences in each sub-plot.
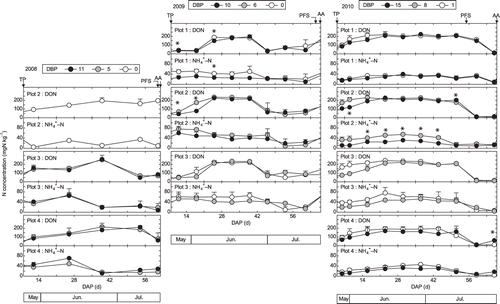
Figure 5. Temporal changes in nitrogen (N) concentrations in soil from additional application to harvest. The symbols and error bars indicate the average and standard deviation of sub-plots (2 sampling points), respectively. DAP, days after ponding; DBP, days before ponding; AA, additional application; EES, ear emergence stage; DON, dissolved organic nitrogen. *Denotes significant differences in each sub-plot.
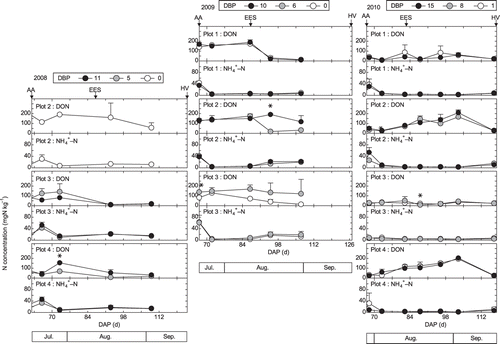
Figure 6. The average values (2 sampling points) of rice (Oryza sativa L.) yield, taste, dry weight, nitrogen (N) concentration, and N content at sub-plots. PFS, panicle formation stage; EES, ear emergence stage; DBP, days before ponding. The error bar indicates standard deviation. The numbers in the figure denote DBP. *Denotes the significance level P < 0.05; **denotes P < 0.01. The black bars indicate that at the same plot in the same year, the values for shorter DBP are smaller than those for longer DBP. The gray bars indicate the reverse, i.e., values for shorter DBP are greater than those for longer DBP.
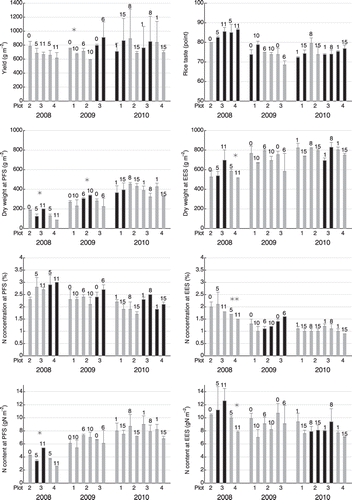
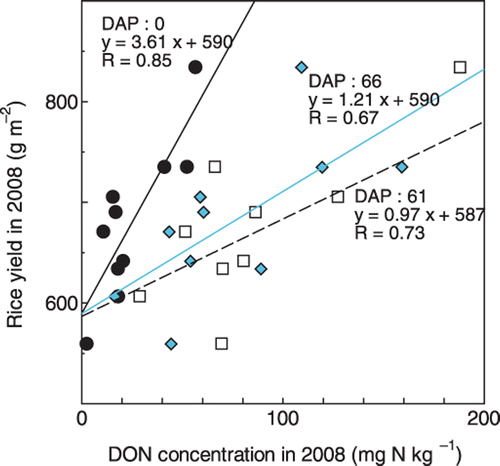
Figure 7. The correlations between the dissolved organic nitrogen (DON) concentration and rice yield in 2008 at days after ponding (DAP) = 0, 61, and 66.