Figures & data
Table 1. Soil description. N = nitrogen; C = carbon
Figure 1. Apparatus used for collecting the soil solution.
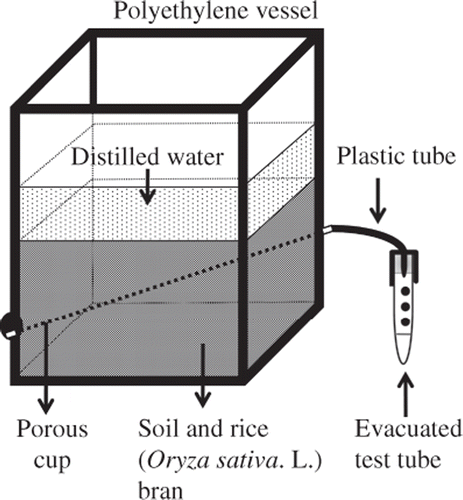
Figure 2. Relationship between the germination percentage and the addition of rice bran. The broken lines indicate the regression lines of electric conductivity (EC). **: Significant at 1% level. Vertical bars indicate standard deviation (n = 5).
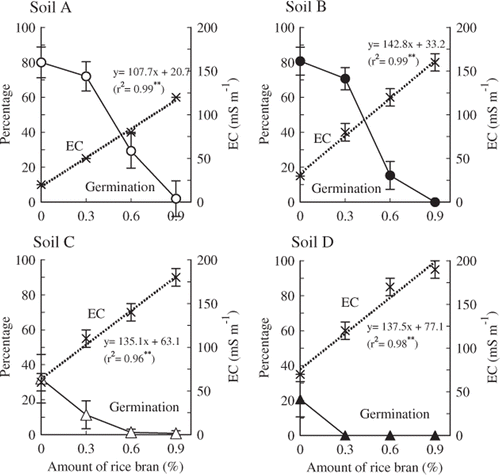
Figure 3. Relationship between the germination percentage and electric conductivity (EC) of soil solution.
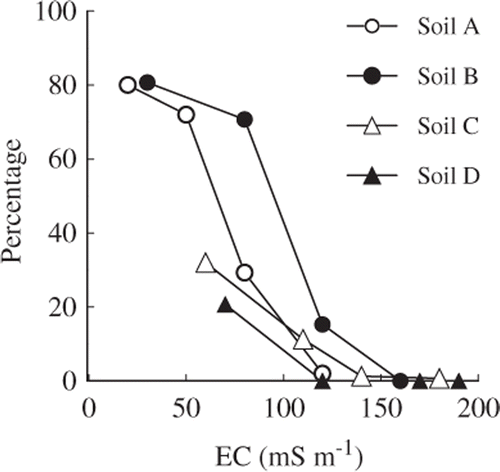
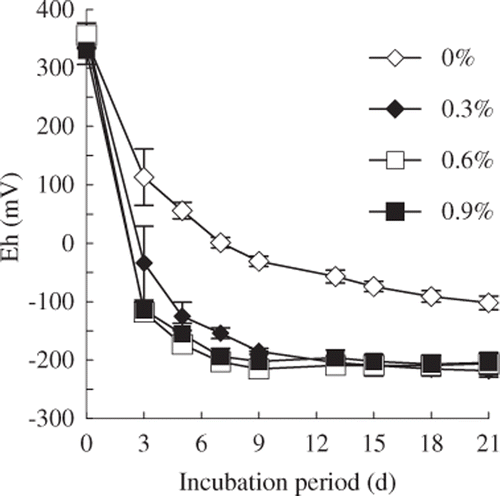
Figure 4. Changes in the values of oxidation-reduction potential (Eh) of soil A. Vertical bars indicate standard deviation (n = 5).