Figures & data
Figure 1. The linear and non-linear relationships between chlorophyll content index (CCI) and total chlorophyll (mg g−1) (a), and CCI and nitrogen (N) content (%) (b) in leaves of the Damask rose (Rosa damascena Mill). R2 is the coefficient of determination. Root mean square error for calibration (RMSEc) of respective regression lines are given in .
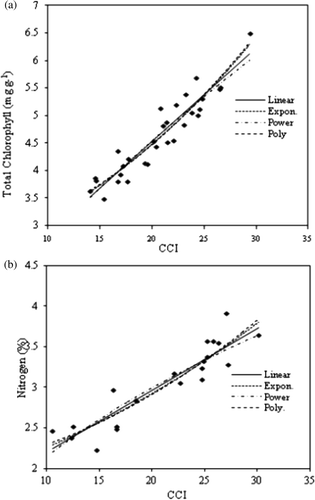
Figure 2. Validation of the developed models for estimating total chlorophyll (Chl) (a) and nitrogen (b) content in leaf. Solid lines are Chl pred = Chl obj (a) and nitrogen pred = nitrogen obj (b); dotted lines are best-fit function for predicted values versus observed values. *** indicates the level of significance (P < 0.001).
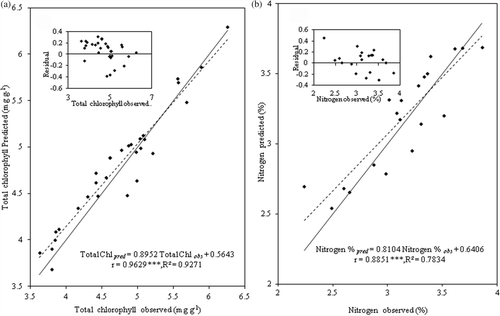
Table 1. Regression models and estimated parameters for non-destructive estimation of chlorophyll and nitrogen content
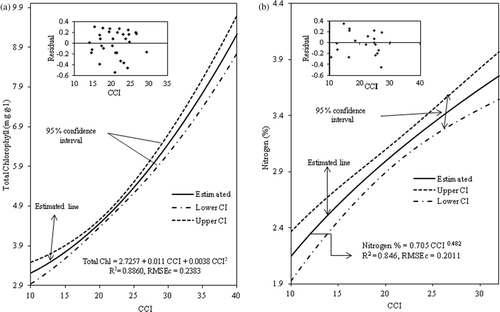
Figure 3. The best fitted regression line for estimating total chlorophyll (a) and nitrogen (b) content in leaf with 95% confidence intervals. The lower and upper dotted curved lines demarcate the range of the 95% confidence interval whereas the solid regression line itself represents the best-fit function for estimating total chlorophyll (a) and nitrogen (b). There is a 95% probability that the actual value is between the upper and lower confidence intervals. CCI, chlorophyll content index; CI, confidence interval.