Figures & data
Figure 1 The cultivation system of the tea plants (Camellia sinensis L. var. sinensis) in Saitama prefecture. Skiffing tea plants are subjected to plucking to restore the vigor of old plants and to maintain the height of the plucking surface. Crude tea is distributed by the producers to the wholesalers, and manufactured tea, after refining, is marketed to the consumers.
Figure 2 Division of the tea (Camellia sinensis L. var. sinensis) -producing areas investigated. Circles indicate the locations of the study sites. No. 1: tea-producing areas (n = 1306); no. 2: areas around tea-producing area (n = 233); no. 3: mountain areas (n = 273).
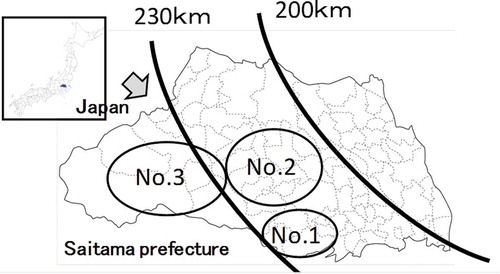
Figure 3 Radiocesium concentrations in the first tea crop on the tea plants (Camellia sinensis L. var. sinensis), May to June, in Saitama Prefecture in 2012. Means of all samples collected from three areas are shown with standard errors (SE). No. 1: tea-producing areas, n = 217; no. 2: area around tea-producing areas, n = 94; no. 3: mountain areas, n = 58. Vertical bars indicate ± standard error (SE), and any bars followed by the same letter are not significantly different according to the Tukey–Kramer test (P < 0.05). DW: dry weight.
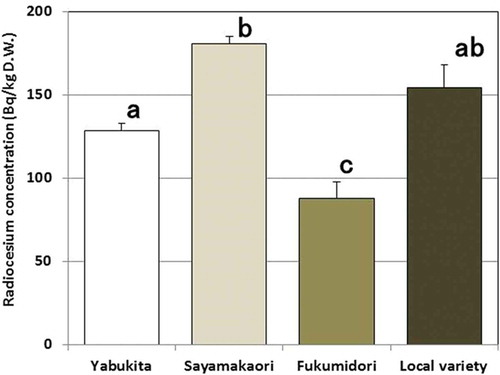
Figure 4 Radiocesium concentrations in the first and second tea crops on the tea plants (Camellia sinensis L. var. sinensis), in Saitama Prefecture in 2012. Vertical bars indicate ± standard error (SE), and any bars followed by the same letter are not significantly different according to the Tukey–Kramer test (P < 0.05). DW: dry weight.
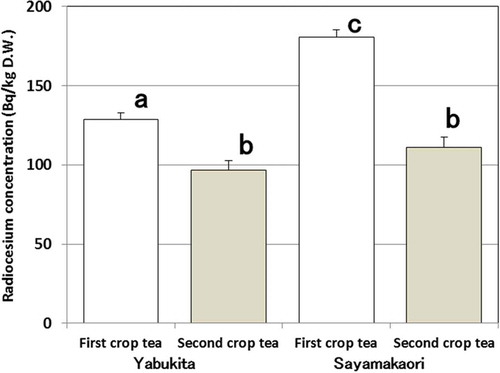
Figure 5 Periodic change in radiocesium concentration among four cultivars of tea plants (Camellia sinensis L. var. sinensis) in the first cropping season in 2012. Each datum represents the samples collected on the date given on the horizontal axis. DW: dry weight.
Figure 6 Radiocesium concentration in (a) tea canopy and (b) soils under tea trees on the tea plants (Camellia sinensis L. var. sinensis).
Figure 7 Relationship of radiocesium concentration among crude tea of the first crop, its green leaves, skiffing branch in the first crop and crude tea of the second crop on the tea plants (Camellia sinensis L. var. sinensis) in 2012. Asterisks represent significant differences between radiocesium concentrations of the first tea crop and skiffing branches (P < 0.01). DW: dry weight.