Figures & data
Table 1 Timing of fertilizer application and the kinds and amounts of nitrogen (N) fertilizers applied to each treatment plot
Table 2 Cumulative nitrous oxide (N2O) emissions from three treatment plots
Figure 1 Time series data for N2O flux from soil between canopy of tea plants and daily rainfall. Means of three replicates +standard error of means. LN, plot supplemented with lime nitrogen; DCD, plot supplemented with dicyandiamide. Dotted line shows timing of nitrogen fertilizer application. Gray background shows periods I and III.
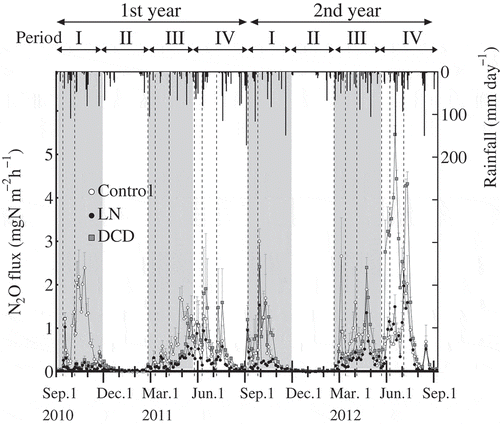
Figure 2 Time series data for (a) daily rainfall and soil temperature at 10-cm depth between canopy of tea plants and (b) Water filled pore space (WFPS) and oxygen (O2) concentration at 10-cm depth between canopy of tea plants. Dotted line shows timing of nitrogen fertilizer application.
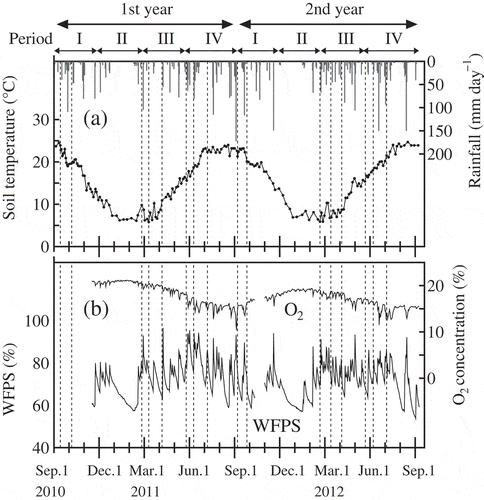
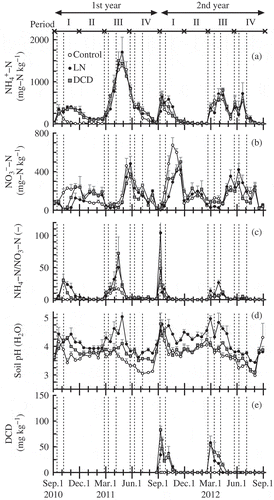
Figure 3 Time series data for (a) ammonium-nitrogen (NH4+-N) concentration in soil, (b) nitrate-nitrogen (NO3--N) concentration in soil, (c) ratio of NH4+-N to NO3–-N concentration in soil, (d) soil pH (H2O), and (e) dicyandiamide (DCD) concentration in soil. Means of three replicates +standard error of means. LN, plot supplemented with lime nitrogen; DCD, plot supplemented with DCD. Dotted line shows timing of nitrogen fertilizer application. (-) means dimensionless.