Figures & data
Figure 1 Classification of leaf chlorosis (“None” indicates the normal leaf without chlorosis; “I” indicates the first level of leaf chlorosis: the leaf tip was slightly chlorotic; “II” indicates the second level of leaf chlorosis: the leaf tip was completely chlorotic; “III” indicates the third level of leaf chlorosis: the chlorosis along the margins has expanded and the leaves were necrotic).
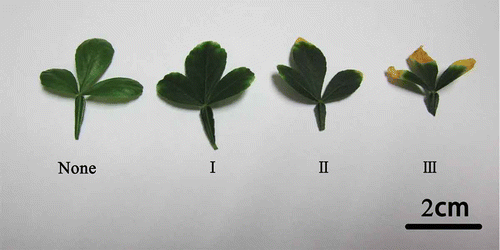
Table 1 Effects of different boron (B) treatments on the seedling height (cm), leaf numbers and dry weight (leaf, stem, root, total) (g) (mean ± standard error, SE)
Table 2 The proportion of different chlorotic levels in chlorotic leaves of different boron (B) treatments (%) (mean ± standard error, SE)
Figure 2 Boron (B) concentration of the root, stem, new leaves (N-Leaf) and old leaves (O-Leaf) between different B treatments. Different letters indicate significant differences at P < 0.05 by Tukey (n = 3). DW, dry weight.
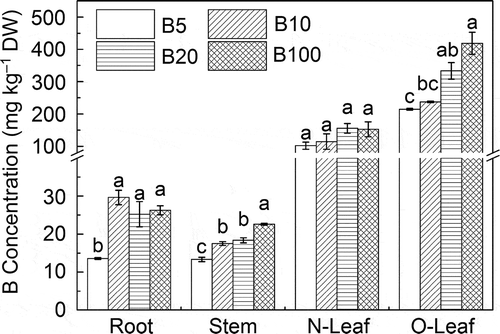
Figure 3 Boron (B) forms (free B, semi-bound B, bound B) in (a) root and (b) stem (mean ± standard error, SE). FW, fresh weight.
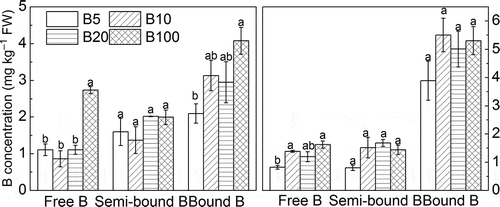
Table 3 Free boron (B) in different chlorotic leaves with different treatments (mg kg–1 fresh weight, FW) (mean ± standard error, SE)
Table 4 Semi-bound boron (B) in chlorottic leaves of different treatments (mg kg–1 fresh weight, FW) (mean ± standard error, SE)
Table 5 Bound boron (B) in chlorotic leaves of different treatments (mg kg–1 fresh weight, FW) (mean ± standard error, SE)
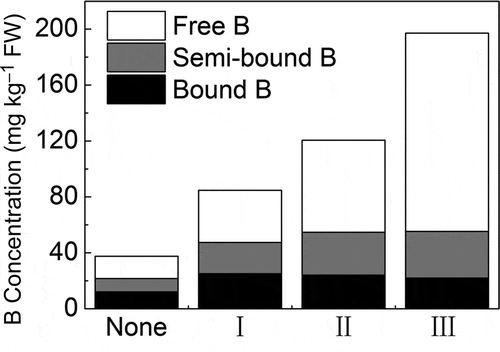
Figure 4 Different forms of boron (B) in different level leaves (data in the figure are the means of B concentrations in different treatments). FW, fresh weight.