
Figures & data
Figure 1 Production of nitrous oxide (N2O) during soil incubations sampled weekly. Value followed by different letters indicate significant different (least significant difference, LSD; P < 0.05). The error bars indicate the standard deviations. N, nitrogen.
Figure 2 Production of carbon dioxide (CO2) during soil incubations sampled weekly. Value followed by different letters indicate significant different (least significant difference, LSD; P < 0.05). The error bars indicate the standard deviations.
Table 1 Levels of ammonium (NH4+) (μg N g−1) accumulated during incubation of the silt loam soil
Table 2 Levels of nitrate (NO3–) (μg N g−1) accumulated during incubation of the silt loam soil
Figure 3 Height (cm) of upland kangkong (Ipomoea aquatica Forsk.) grown in pots. Treatments are: control (no amendment), Azolla Compost low (80.3 g m−2), Azolla Compost medium (160.5 g m−2), Azolla Compost high (240.8 g m−2), Urea (10 g N m−2). Different letters refer to significant differences (least significant difference, LSD; P < 0.05).
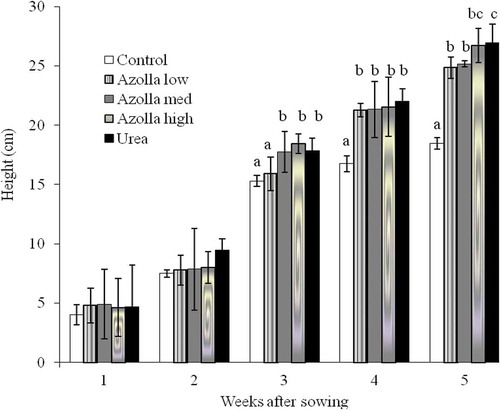
Table 3 Plant biomass (dry weight, grams per pot) of aboveground upland kangkong (Ipomoea aquatica Forsk.) studied in a pot experiment. Soil treatments are the same as for . Different letters refer to significant differences (least significant difference, LSD; P < 0.05)