
Figures & data
Figure 1 Map of study sites in Indonesia and Malaysia.
Figure 2a Precipitation, soil moisture tension, soil temperature, nitrous oxide (N2O) flux and carbon dioxide (CO2) flux in Tunggal sandy loam soil. Vertical bars indicate ± standard deviation. Treatment B: no nitrogen (N) fertilizer and no tillage; C: conventional fertilizer; B2: no N fertilizer with tillage; M: coated fertilizer. Solid arrows and dashed arrows indicate conventional and coated fertilization timing, respectively. Vertical dashed lines indicate transition period for dry and wet seasons.
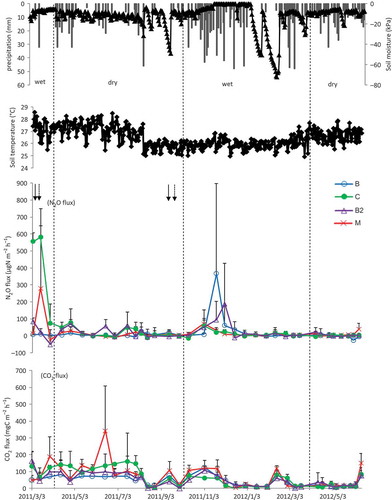
Figure 2b Precipitation, soil moisture tension, soil temperature, N2O flux, and CO2 flux, in Simunjan sandy soil. See details for other remarks in .
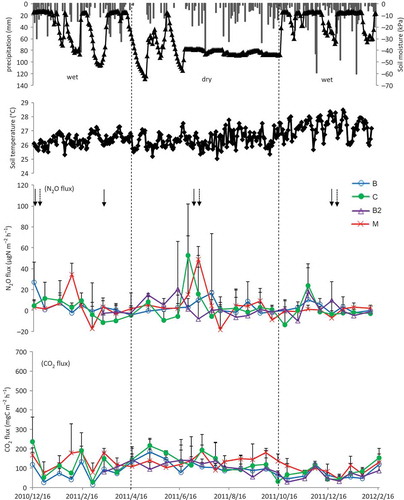
Figure 2c Precipitation, soil moisture tension, soil temperature, N2O flux, and CO2 flux, in Tatau peat soil. See details for other remarks in .
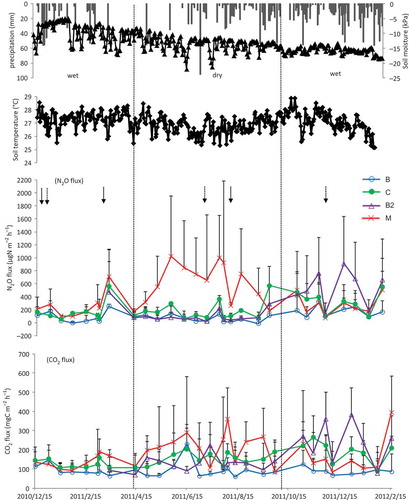
Table 1 Descriptions and physicochemical characteristics of soils at the oil palm plantation study sites
Table 2 Nitrous oxide (N2O) fluxes for the three study sites during wet and dry seasons
Table 3 Cumulative nitrous oxide (N2O) fluxes for the three study sites
Table 4 Emission factors (EF) calculated for the three study sites
Table 5 Pearson correlation of nitrous oxide (N2O) emission factors (EF) between the conventional fertilizer and the coated fertilizer among soil parameters for the three study sites (n = 9)
Table 6 Carbon dioxide (CO2) fluxes for the three study sites during the wet and dry seasons
Table 7 Cumulative carbon dioxide (CO2) fluxes for the three study sites