Figures & data
Figure 1 Upper panel: map representing Italy and the boundaries of the 20 administrative regions (northern Italy: Va, Pi, Li, Lo, Tr, Ve, Fr, Em; central Italy: Tu, Ma, Um, La; southern Italy: Ab, Mo, Ca, Ap, Ba, Cal, Si, Sa). Lower panels: maps representing the distribution of the National Protected Areas (NPAs, left) and Natura2000 sites (right) in Italy.
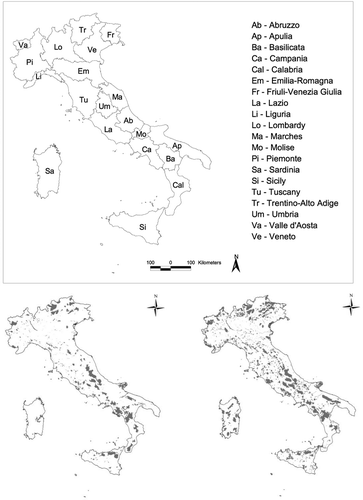
Table 1 List of variables used in the Environmentally Sensitive Area (ESA) framework by theme, measurement unit and statistical source
Figure 2 A flowchart illustrating the Environmentally Sensitive Area (ESA) methodology. ESAI, Environmentally Sensitive Area Index.
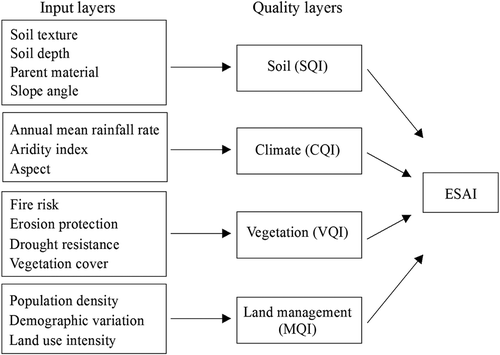
Table 2 Land classification based on hotspot analysis (for abbreviations, see paragraph 3.4)
Table 3 Descriptive statistics of the partial indicators (SQI, CQI, VQI, MQI) and the composite index (ESAI) by geographical division and land protection regime in Italy
Figure 3 Spatial distribution of soil vulnerability hotspots in Italy (1990–2010) based on the land classification system illustrated in .
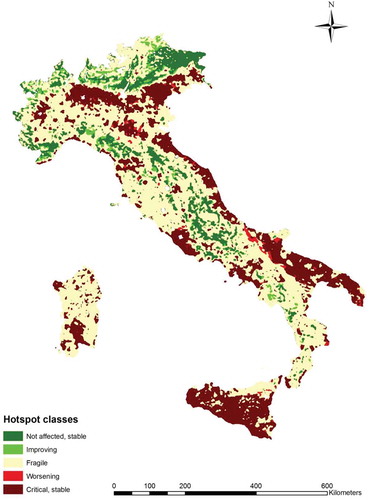
Table 4 Percent distribution of land by hotspot class, geographical division and land protection regime
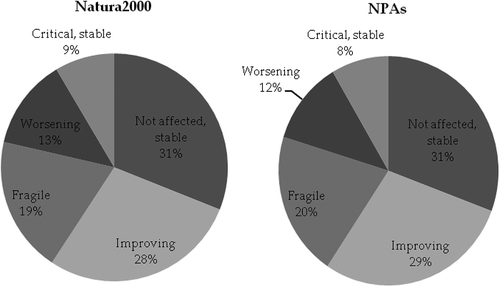
Figure 4 Percent class area under the Natura2000 and National Protected Areas (NPAs) regime on the total surface area of each hotspot class in Italy.