Figures & data
Table 1 Soil pH, organic carbon (C), ammonium nitrogen (NH4+-N), nitrate nitrogen (NO3–-N), Olsen phosphorus (Olsen-P) and ammonium acetate-extractable potassium (NH4OAc-K) after long-term (24-year) treatments with mineral fertilizer and/or organic manure in an acidic red soil
Figure 1 The abundance of archaeal amoA genes after long-term (24-year) treatments with mineral fertilizer and/or organic manure in an acidic red soil. Values (means ± standard error, SE, n = 3) followed by the same letter above the bars are not significantly different determined using least significant difference (LSD) test (p < 0.05). CK, N, NPK, OM and OM+NPK are the control; mineral nitrogen (N) fertilizer; mineral N, phosphorus (P) and potassium (K) fertilizer; organic manure; and organic manure plus mineral NPK fertilizer treatments, respectively.
Table 2 Diversity indices of ammonia-oxidizing archaea (AOA) after long-term (24-year) treatments with mineral fertilizer and/or organic manure in an acidic red soil
Figure 2 Denaturing gradient gel electrophoresis (DGGE) profiles of archaeal amoA genes after long-term (24-year) treatments with mineral fertilizer and/or organic manure in an acidic red soil. Bands with the same mobility in the DGGE gel were marked with the same number and excised for sequencing. CK, N, NPK, OM and OM+NPK are the control; mineral nitrogen (N) fertilizer; mineral N, phosphorus (P) and potassium (K) fertilizer; organic manure; and organic manure plus mineral NPK fertilizer treatments, respectively.
Figure 3 Redundancy analysis (RDA) of ammonia-oxidizing archaea after long-term (24-year) treatments with mineral fertilizer and/or organic manure in an acidic red soil. CK, N, NPK, OM and OM+NPK are the control; mineral nitrogen (N) fertilizer; mineral N, phosphorus (P) and potassium (K) fertilizer; organic manure; and organic manure plus mineral NPK fertilizer treatments, respectively. Abbreviations: organic C, organic carbon; NH4OAc-K, ammonium acetate-extractable potassium; Olsen-P, Olsen phosphorus.
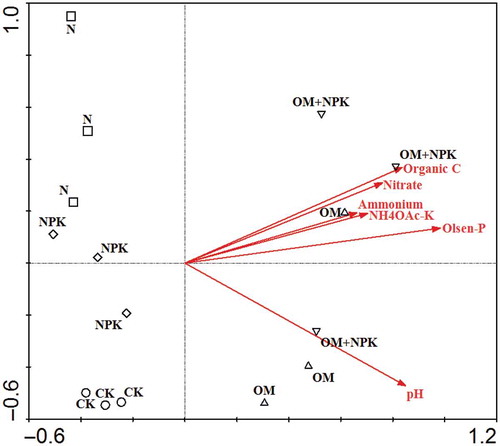
Figure 4 Phylogenetic relationships between partial archaeal amoA sequences retrieved from the denaturing gradient gel electrophoresis (DGGE) bands (in bold) in this study and the GenBank. The accession number for each sequence is shown in brackets. The scale bar indicates five changes per 100 nucleotide positions.
Figure 5 Soil nitrification potential incubated under neutral pH (A) and natural pH (B) after long-term (24-year) treatments with mineral fertilizer and/or organic manure in an acidic red soil. Values (means ± standard error, SE, n = 3) followed by the same letter at 30°C (a, b, c) or 40°C (A, B, C) above the bars are not significantly different, determined using least significant difference (LSD) test (p < 0.05). CK, N, NPK, OM and OM+NPK are the control; mineral nitrogen (N) fertilizer; mineral N, phosphorus (P) and potassium (K) fertilizer; organic manure; and organic manure plus mineral NPK fertilizer treatments, respectively. Abbreviations: NO2–, nitrite; NO3–, nitrate.