Figures & data
Figure 1 The location of the Sahel region.
Figure 2 Daily rainfall for the year with (a) the least rain, (b) the most rain and (c) a severe dry spell at the International Crops Research Institute for the Semi-Arid Tropics (ICRISAT) West and Central Africa (Niger).
Figure 3 Sandstorm causing wind erosion.
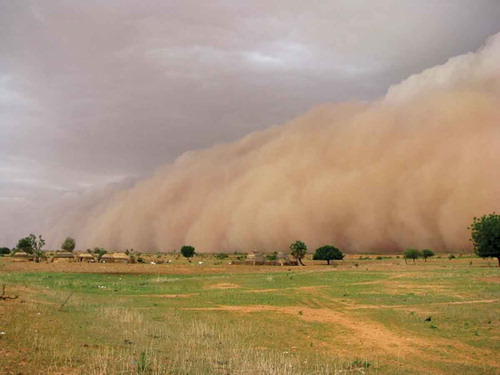
Figure 4 Pearl millet (Pennisetum glaucum (L.) R. Br.) fields unaffected by desertification (left) and heavily affected by desertification (right).
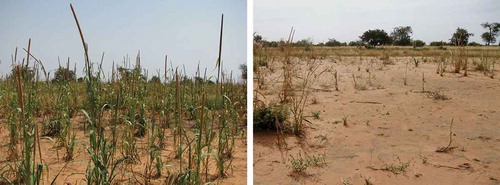
Figure 5 A scene from a field experiment on wind erosion.
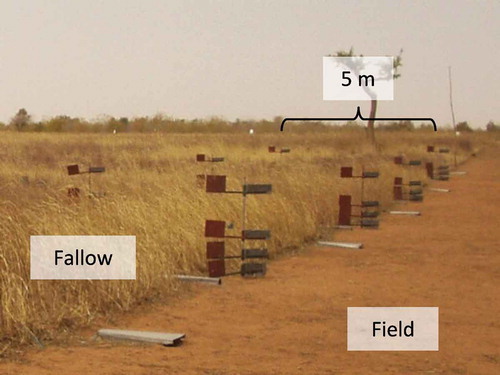
Figure 6 Schematic diagram of the topsoil.
Figure 7 A cross-sectional photograph of a depositional crust (the arrows are pointing at the crust). Photo courtesy of Dr. Ueru Tanaka.
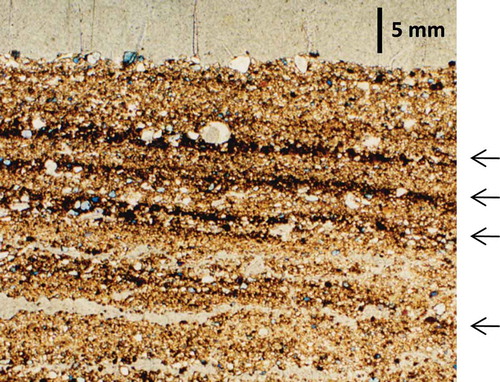
Figure 8 Soil moisture content in the early rainy season (a) in an area where the crust is exposed and (b) in an area with a loose sand layer on top of the crust.
Figure 9 Relationship between the degree of desertification and the spatial heterogeneity of vegetation (hypothesis).
Figure 10 Land use of a field employing the fallow band system.
Figure 11 Trapping efficiency of a single fallow band for the wind-blown soil (combines data presented in Ikazaki et al. Citation2011c, –).
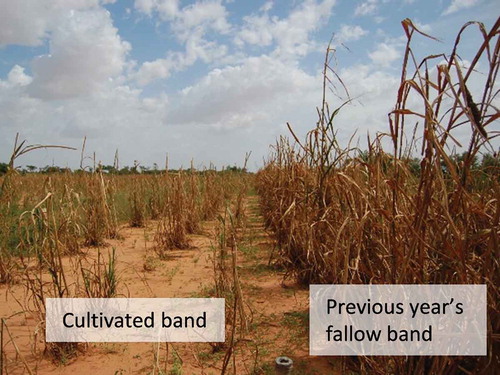
Figure 12 The ground surface at the boundary between the cultivated band and the previous year’s fallow band (the gray area in the cultivated band is where the crust has been exposed).
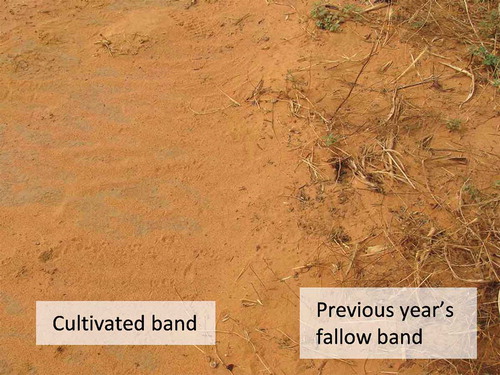
Figure 13 Differences between growth of pearl millet (Pennisetum glaucum (L.) R. Br.) planted in a cultivated band and in the previous year’s fallow band.