Figures & data
Table 1 Chemical properties of the two experimental substrates.
Figure 1 Particle size distributions of the two experimental substrates, determined by means of laser diffraction particle size analysis using an LS 13 320 Beckman Coulter Counter.
Figure 2 Shoot dry weights (A) and phosphorus (P) concentrations (B) of white lupin (Lupinus albus L.) grown at low (–) or high water supply (+), in homogeneous (W hom) or heterogeneous (W het) substrate with no additional P supply (P no), homogeneous P fertilization (P hom) or heterogeneous P fertilization (P het). Bars represent averages of all plants with herringbone root system. The numbers of replicates is given at the bottom of each bar in the lower graph. The error bars give the standard errors of the means.
Figure 3 Examples of root system development at low (A) and high (B) overall water supply. The colors indicate root growth from germination to 12 (red) days after germination (DAG), DAG 12 to 19 (yellow) and DAG 19 to 25 (blue). The two examples were not selected to represent average cases but to highlight the differences between the two water supply treatments. Quantitative analysis of root length distributions over depth is given in the supporting information (S1).
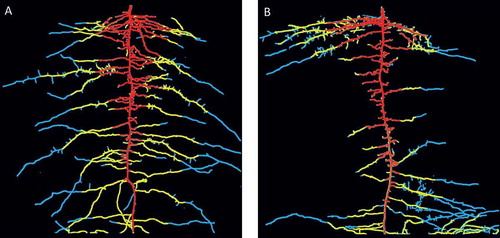
Figure 4 Cluster length (A) and root length (B) of white lupin (Lupinus albus L.) grown at low (–) or high water supply (+) in homogeneous (W hom) or heterogeneous (W het) substrate with no additional phosphorus (P) supply (P no), homogeneous P fertilization (P hom) or heterogeneous P fertilization (P het). The numbers at the bottom of the bars in the lower graph give the number of replicates. The error bars give the standard errors of the means.
Figure 5 Cluster length (A) and root length (B) of white lupin (Lupinus albus L.) in the left (LS, light gray) and right container section (RS, dark gray bar) at low (–) or high water supply (+) in homogeneous (W hom) or heterogeneous (W het) substrate with no additional phosphorus (P) supply (P no), homogeneous P fertilization (P hom) or heterogeneous P fertilization (P het). The error bars give the standard errors of the means.
Figure 6 Precision of cluster length allocation (relative to total root length) of white lupin (Lupinus albus L.) at low (–) or high overall water supply (+) in homogeneous (W hom) or heterogeneous (W het) substrate with no additional phosphorus (P) supply (P no), homogeneous P fertilization (P hom) or heterogeneous P fertilization (P het). The precision of cluster root allocation relative to root length was calculated as the difference in cluster length per root length between the right (RS) and the left container sections (LS) divided by the average ratio between clustered and total length of the roots in the respective container. A value significantly different from zero indicates preferential root allocation in either RS (> 0) or LS (< 0). The error bars represent the Bonferroni-corrected 95% confidence interval of the mean.