Figures & data
Figure 1 Low-calcium (Ca) sensitivity of lcs1-1. (a) Phenotypes of Col-0 and lcs1-1 under 2 mM and 0.2 mM Ca. Plants were grown on the medium for 2 weeks. Scale bar = 1 cm. (b) Shoot fresh weight of Col-0 and lcs1-1. Plants were grown under 2 mM or 0.2 mM Ca for 2 weeks. Bars represent mean ± standard deviation (SD; n = 7 for Col-0 and 4 for lcs1-1 under 2 mM Ca; 14 for Col-0 and 8 for lcs1-1 under 0.2 mM Ca). Asterisks indicate a significant difference between Col-0 and lcs1-1 by Student’s t-test (p < 0.05). (c) Ratio of shoot fresh weight measured in (b). Mean values in (b) are used for the calculation of the ratio.
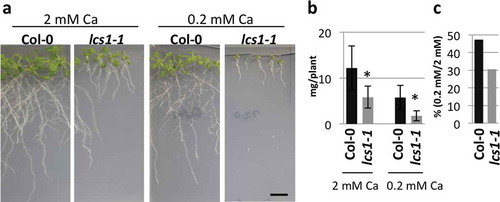
Figure 2 Identification of the causal gene of lcs1-1. (a) Position of causal gene on chromosome 4 and the exon-intron structures of Pleiotropic Regulatory Locus 1 (PRL1) gene. Simple sequence length polymorphism markers are indicated in arrows. Recombinant F2 individuals per total F2 individuals examined are shown under each marker. Insertion site of T-DNA in SALK_008466/prl1-2 and nonsynonymous mutation of lcs1-1/prl1-10 are shown. Filled boxes, gray boxes and thick bars indicate exons encoding a protein, untranslated regions and introns, respectively. (c) Phylogenetic tree of PRL1 homologs. Homologs of PRL1 are searched by SALAD database v. 3 (Mihara et al. Citation2009). The tree was constructed by Unweighted Pair Group Method with Arithmetic mean methods based on amino acid sequences. YPL: Saccharomyces cerevisiae, GSVIVP: Vitis vinifera, Sm: Selaginella moellendorffi, Pp: Physcomitrella patens, Sb: Sorghum bicolor, Cr: Chlamydomonas reinhardti, Ot: Ostreococcus trauri.
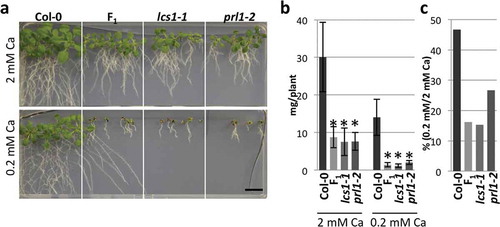
Figure 3 Low-calcium (Ca) sensitivity of lcs1-1 and prl1-2. (a) Phenotypes of Col-0, lcs1-1, prl1-2 and F1 plants between lcs1-1 and prl1-2 under 2 mM and 0.2 mM Ca. Plants were grown on the medium for 2 weeks. Scale bar = 1 cm. (b) Shoot fresh weight of Col-0, lcs1-1, prl1-2 and F1 plants. Bars represent mean ± standard deviation (SD; n = 4 for Col-0, 6 for F1, 5 for lcs1-1 and 5 for prl1-2 under 2 mM Ca; 6 for Col-0, 6 for F1, 4 for lcs1-1 and 3 for prl1-2 under 0.2 mM Ca). Asterisks indicate a significant difference between Col-0 and mutants by Dunnett’s test (p < 0.05). (c) Ratio of shoot fresh weight of Col-0, lcs1-1, prl1-2 and F1 plants between under 2 mM and 0.2 mM Ca. Mean values in (b) are used for the calculation of the ratio.