3,924
Views
10
CrossRef citations to date
0
Altmetric
Soil fertility

Practices sustaining soil organic matter and rice yield in a tropical monsoon region

, &
Pages 274-287 | Received 16 Sep 2016, Accepted 24 Apr 2017, Published online: 06 Jun 2017

Figures & data

Figure 1. Study area and soil series (LDD Citation2003).

Figure 1. Study area and soil series (LDD Citation2003).

Figure 2. Overall land management practice in the study area.

Figure 2. Overall land management practice in the study area.

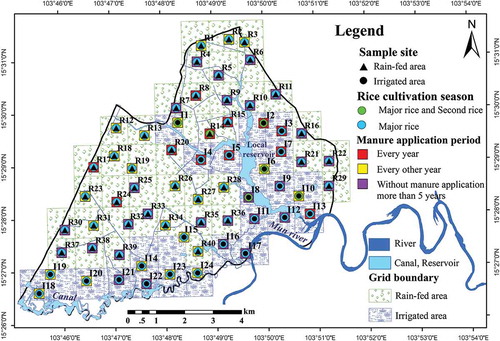
Table 1. Main management practices, rice yield, and SOC in irrigated areas (n = 24).

Table 2. Main management practices, rice yield, and SOC in rain-fed areas (n = 40).

Table 3. Comparison of the annual main management practices between irrigated and rain-fed areas (mean ± SD).

Table 4. Comparison of soil physical and chemical properties between irrigated and rain-fed areas for all soil depths (0–40 cm) (mean ± SD).

Table 5. Average values of soil physical and chemical properties at four different depths, 0–10, 10–20, 20–30, and 30–40 cm from all sites (mean ± SD).

Table 6. Correlation matrix of soil physical and chemical properties with SOC at all sites (n = 64).

Table 7. Comparison of rice yield and SOC between irrigated and rain-fed areas (mean ± SD).

Figure 3. Relationship between rice yield and SOC at all sites. The dashed line and solid line were fitted by simple linear regression for irrigated and rain-fed areas, respectively.

Figure 3. Relationship between rice yield and SOC at all sites. The dashed line and solid line were fitted by simple linear regression for irrigated and rain-fed areas, respectively.

Figure 4. Relationship between rice yield and N, P, and K application rates: (A) irrigated areas; (B) rain-fed areas.

Figure 4. Relationship between rice yield and N, P, and K application rates: (A) irrigated areas; (B) rain-fed areas.

Figure 5. Relationship between rice yield and the period of manure application: every year, every other year, and without manure application for more than 5 years: (A) irrigated areas; (B) rain-fed areas.

Figure 5. Relationship between rice yield and the period of manure application: every year, every other year, and without manure application for more than 5 years: (A) irrigated areas; (B) rain-fed areas.

Figure 6. Comparison of rice yield and SOC between irrigated and rain-fed areas under the period of manure application (men ± SD): (A) irrigated areas; (B) rain-fed areas.

Figure 6. Comparison of rice yield and SOC between irrigated and rain-fed areas under the period of manure application (men ± SD): (A) irrigated areas; (B) rain-fed areas.

Table 8. Multiple regression equations used to predict SOC and rice yield using manure (M), N fertilizer (N), P fertilizer (P), and K fertilizer (K).

Reprints and Corporate Permissions

Please note: Selecting permissions does not provide access to the full text of the article, please see our help page How do I view content?

To request a reprint or corporate permissions for this article, please click on the relevant link below:

Academic Permissions

Please note: Selecting permissions does not provide access to the full text of the article, please see our help page How do I view content?

Obtain permissions instantly via Rightslink by clicking on the button below:

If you are unable to obtain permissions via Rightslink, please complete and submit this Permissions form. For more information, please visit our Permissions help page.