Figures & data
Figure 1. Sensitivity of atg mutants to Zn limitation. (A) Diagram of treatment. Seeds were sown on Zn- and sucrose-added agarose medium and grown for 7 d. Then the seedlings were transferred to Zn-added and sucrose-deficient agarose medium and grown for 7 d. The 14-day-old seedlings were transferred to agarose medium where Zn was not added for various lengths of time, and then transferred back to Zn-added medium and grown for 7 d. (B) Fresh weight of wild-type plants and atg mutants after the 7 d recovery from Zn limitation. Values are given as means ± SE (n = 16). Statistical analysis was performed by ANOVA followed by Tukey’s test. Values with the same letters are not significantly different from each other on the same day (P < 0.05). (C) Pictures of wild-type plants and atg mutants after Zn limitation and after 7 d recovery from Zn limitation. Red arrowheads indicate leaves showing early senescence phenotype, and light-blue arrowheads indicate dead leaves after the recovery (bars = 5 mm).
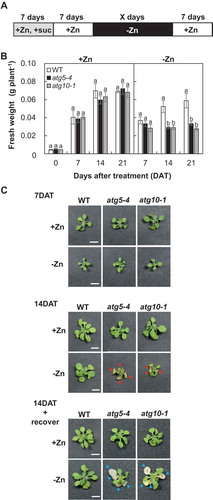
Figure 2. Expression analysis of ZIP4 (A) and ATGs (B) in shoots of wild-type plants under Zn limitation by quantitative RT-PCR. Gene expression was normalized with an internal standard, 18S rRNA expression. Values are given as means ± SE (n = 3). Statistical analysis was performed by ANOVA followed by Student’s t-test. Values with an asterisk were significantly different from each other on the same day (P < 0.05).
Figure 3. Visualization of autophagic bodies by GFP-ATG8a under Zn limitation. (A) Visualization of autophagic bodies by LSCM. Transgenic plants expressing GFP-ATG8a were placed for 7 d under Zn limitation or the control condition. The first leaves and sixth leaves were excised from plants and then treated with 1 µM concanamycin A for 12 h to stabilize autophagic bodies in the vacuole. Box outlined in the upper right panel was magnified about 7.4 times in (bars = 50 µm). (B) Magnification of a cell of the first leaf of Zn-limited plant. White arrowheads indicate autophagic bodies labeled with GFP-ATG8a (bars = 10 µm). (C) Quantification of autophagic bodies. Values are given as means ± SE (n = 3). Statistical analysis was used to examine the differences in numbers of autophagic bodies between first leaf and sixth leaf. Statistical analysis was performed by ANOVA followed by Student’s t-test. Values with an asterisk are significantly different from each other (P < 0.05).
Figure 4. Zn concentration in wild-type plants and atg mutants under Zn limitation. Zn concentration in wild-type plants and atg mutants exposed to Zn limitation for 0, 7, and 14 d were measured by ICP-MS. Values are given as means ± SE (n = 3). Statistical analysis was performed by ANOVA followed by Tukey’s test. Values with the same letters are not significantly different from each other on the same day (P < 0.05).
Figure 5. Comparison of expressions of Zn-deficiency-responsible genes in atg mutants with those in wild-type plants under Zn limitation. Gene expression was normalized with 18S rRNA expression. Values were normalized by the value of wild-type plants in the Zn-added condition. Values are given as means ± SE (n = 3). Statistical analysis was performed by ANOVA followed by Tukey’s test. Values with the same letters are not significantly different from each other (P < 0.05).
Figure 6. O2– and the H2O2 levels in atg mutants under Zn limitation. O2– levels and H2O2 levels in the first and sixth leaves were quantified by NBT and DAB staining, respectively. Values are given as means ± SE (n = 3). Statistical analysis was performed by ANOVA followed by Tukey’s test. Values with the same letters are not significantly different from each other (P < 0.05).