
Figures & data
Table 1. Physical and chemical properties of acid sulfate paddy soil at Prachin Buri Rice Research Center, not determined.
Table 2. Key crop cultivation practices and dates in the dry seasons(DS) and wet seasons (WS).
Figure 1. Seasonal variations in daily rainfall (a, b, c), daily maximum and minimum air temperature (d, e, f), mean surface water level (g, h, i), CH4 flux (j, k, l), and N2O flux (m, n) for three water management practices in dry season (DS1, DS2, and DS3). Error bars for CH4 and N2O fluxes indicate the standard error (n = 3). Vertical dotted lines indicate the application timing of nitrogen fertilizer. Gray areas in a and d indicate the lack of data observation.
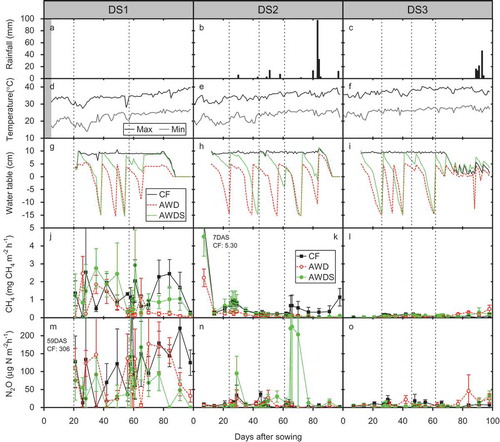
Figure 2. Seasonal variations in daily rainfall (a, b), daily maximum and minimum air temperature (c, d), mean surface water level (e, f), CH4 flux (g, h), and N2O flux (i) for three water management practices wet seasons (WS1 and WS3). Error bars for CH4 and N2O fluxes indicate the standard error (n = 3). Vertical dotted lines indicate the application timing of nitrogen fertilizer. Inserted panels in e and f show the magnified y-axis for the high values.
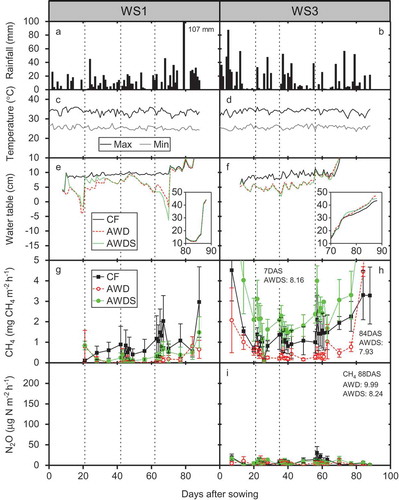
Table 3. Statistical analysis results of combined seasonal means of CH4, N2O, grain yield, and water use, with the effects of both treatment (Trt), growing season (s), and a combination of treatment and season (S × Trt).