Figures & data
Table 1. Soil properties of the experimental site.
Table 2. Rice cropping calendar in the winter–spring (WS) and summer–autumn (SA) seasons.
Table 3. Seasonal CH4 and N2O emissions, GWP, rice grain yield, yield-scaled GWP, total water use, and water productivity as affected by cropping season and water management.
Figure 1. Seasonal variations in daily rainfall (A, B, C), daily maximum and minimum air temperature (D, E, F), mean surface water level (G, H, I), CH4 flux (J, K, L), and N2O flux (M, N, O) for three water management practices in the first, second, and third winter–spring seasons (WS). Error bars for CH4 and N2O fluxes indicate the standard error (n = 3). Vertical dotted lines indicate the application timing of nitrogen fertilizer.
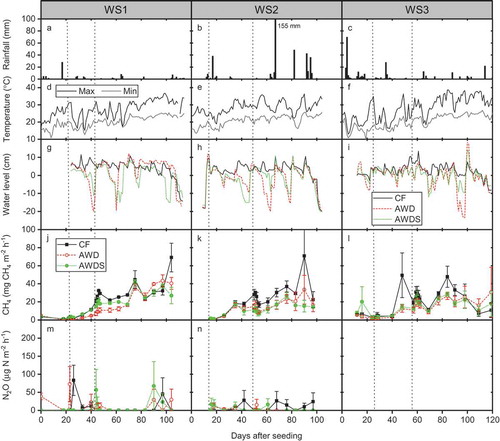
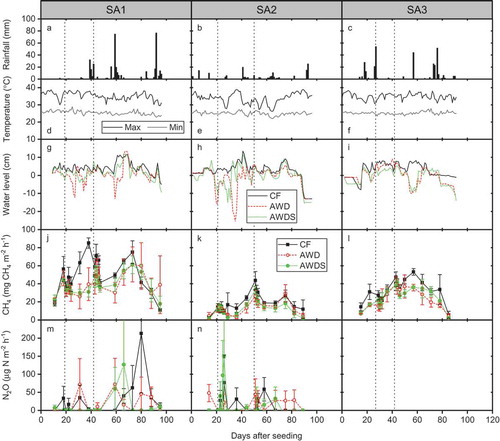
Figure 2. Seasonal variations in daily rainfall (A, B, C), daily maximum and minimum air temperature (D, E, F), mean surface water level (G, H, I), CH4 flux (J, K, L), and N2O flux (M, N, O) for three water management practices in the first, second, and third summer–autumn seasons (SA). Error bars for CH4 and N2O fluxes indicate the standard error (n = 3). Vertical dotted lines indicate the application timing of nitrogen fertilizer.