Figures & data
Figure 1. Locations of the four experimental sites.
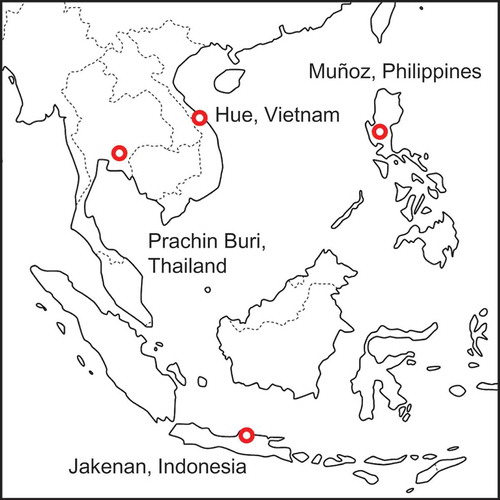
Table 1. Location, soil properties, season, weather, and field management of the four experimental sites.
Figure 2. Comparison of the soil profiles in the four experimental sites. The soil profiles are arranged according to the apparent soil redox condition with showing the USDA and FAO classifications.
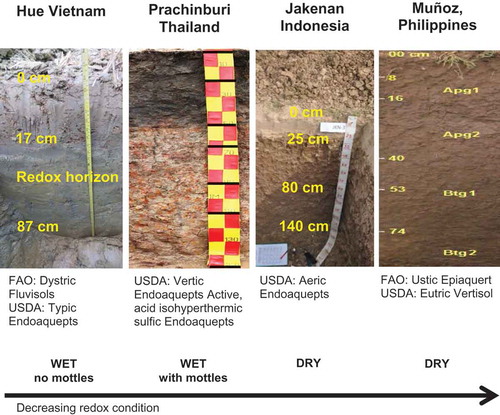
Figure 3. Relationships between (A) predicted SFCH4-AWD and observed SFCH4-AWD and (B) observed SFCH4-AWD and NNFD for the data in Hue and Jakenan (n = 24; 2 sites × 6 seasons × 2 practices (AWD and AWDS)). In A panel, dotted line indicates the linear regression between predicted and observed SFCH4-AWD. In B panel, solid and dotted lines indicate the multiple regression line with MinWL of −15 cm and the linear regression between observed SF and NNFD, respectively.
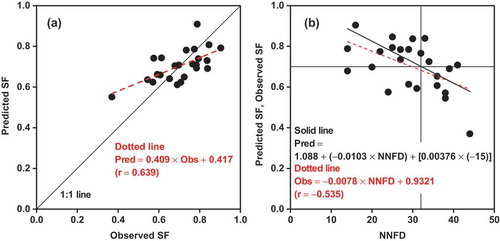
Figure 4. Interannual variations in total carbon content at a soil depth of 0–20 cm among three water management practices in (A) Hue, (B) Jakenan, (C) Muñoz, and (D) Prachin Buri. Vertical bars indicate the standard deviation (n = 3–4).
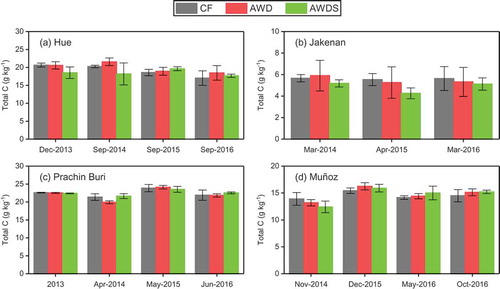
Table 2. Comparison of alternate wetting and drying (AWD) implementation among the four experimental sitesa.
Table 3. Comparisons of the effects of AWD on greenhouse gas emissions, rice productivity, and water use among the four experimental sites.
Figure 5. CH4 emission-related parameters in the four experimental sites. (A) Emission factors (EF) for CF and AWD. (B) AWD scaling factors (SF). Data in dry season are shown for Prachin Buri. Data in dry and wet seasons are shown separately for Muñoz. Mean data in dry and wet seasons are shown for Hue and Jakenan. Means overall sites and seasons with and without Muñoz wet season are separately shown. The horizontal bars for each site indicate the 95% confidence intervals. Bars for IPCC (Citation2006) indicate the error range given in the IPCC (Citation2006) guidelines. In A panel, the values for Prachin Buri CF and AWD are 0.024 ± 0.027 and 0.031 ± 0.041, respectively.
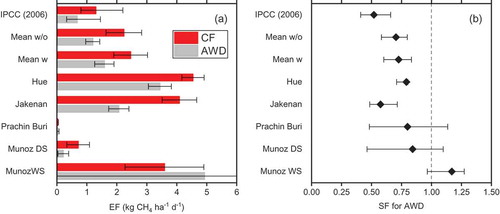
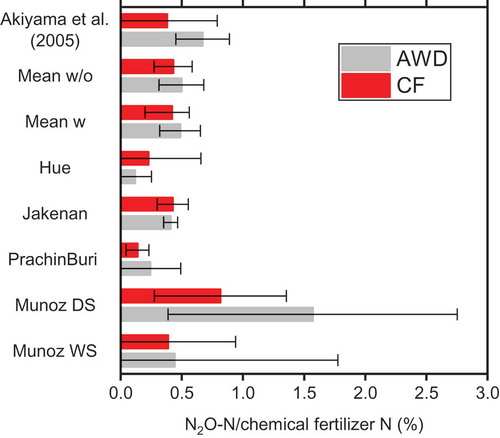
Figure 6. The ratio of seasonal N2O-N emissions to the total amount of chemical fertilizer N applied. Data for dry season and wet season are shown separately for Muñoz. Mean data in dry and wet seasons are shown for Hue, Jakenan, and Prachin Buri. Means overall sites and seasons with and without Muñoz wet season are separately shown. The horizontal bars indicate the 95% confidence intervals.