Figures & data
Table 1. Selected physical and chemical properties of soil samples.
Figure 1. Transmission electron micrographs of the citrate-dithionite-treated clay fractions of LeTrab 2Bt3 and Red Tank 2Bt3 samples. Reference scales are 0.5 µm.
Figure 2. X-ray diffractograms of CD-air dried and CD-reduced pressure dried clay fractions of LeTrab 2Bt3 and Red Tank 2Bt3 samples.
Table 2. Permanent and variable negative charges of clay fractions after the treatments.
Table 3. Average and standard deviation values of adsorbed Ca2++K+ in K+-Ca2+ exchange equilibrium study for clay fractions of LeTrab and Red Tank soils.
Figure 3. Equivalent fractions of adsorbed K+ (EK) vs. equivalent fraction of solution K+ (ĒK) for clay fractions with the treatments. Non-preference line (dashed line) calculated following Sposito et al. (Citation1983).
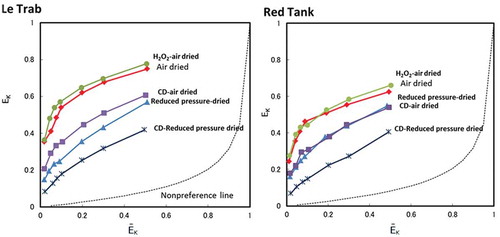
Figure 4. The Vanselow selectivity coefficient (ln KV) as a function of the equivalent adsorbed fraction of K+ (EK) for clay fractions with the treatments.
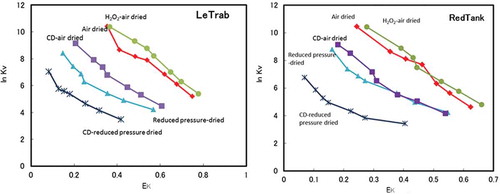
Figure 5. Transmission electron micrographs of the citrate-dithionite-treated clay fractions of Aiken Bt3 and Aiken Bt4 soils.
Figure 6. X-ray diffractograms of CD-air dried clay fractions of Aiken Bt3 and Aiken Bt4 soils.
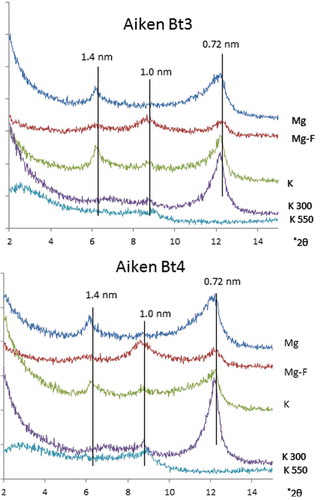
Table 4. Average and standard deviation values of adsorbed Ca2++K+ in K+-Ca2+ exchange equilibrium study for fine earth fractions (<2 mm) of LeTrab, Red Tank and Aiken soils.
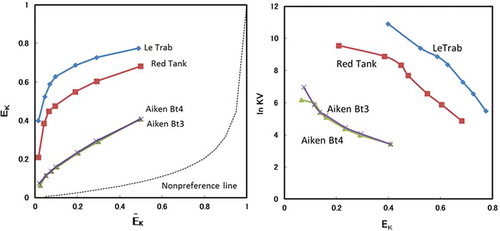
Figure 7. Equivalent fractions of adsorbed K+ (EK) vs. equivalent fraction of solution K+ (ĒK) (left) and the Vanselow selectivity coefficient (ln KV) as a function of the equivalent adsorbed fractions of K+ (EK)(right) for fine earth fractions (<2 mm). Non-preference line (dashed line) calculated following Sposito et al. (Citation1983).